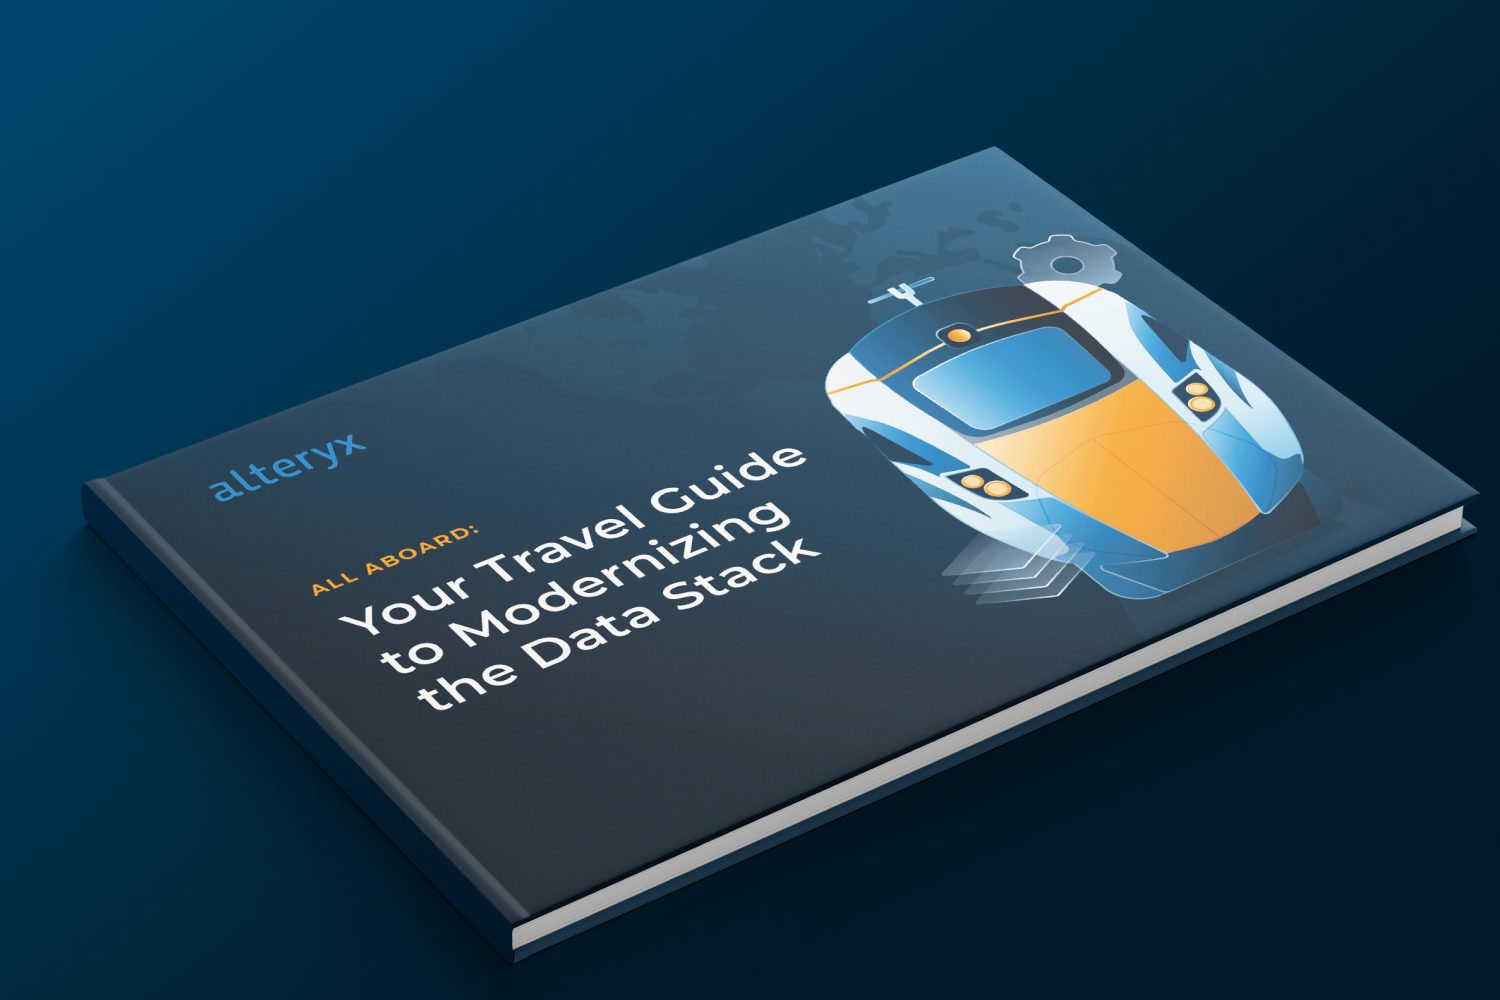
Overview
I was tasked with creating an E-book that mimics a travel guide with relevant imagery on optimizing your data stack for business. I explored different options for different imagery in our booklet (like maps, trains, binoculars, etc).
I worked with the lead visual designer, Azusa M. , to create an immersive booklet. The goal of the project was to inform our users about how to plan a data stack, similar to how you plan a vacation.

Early Drafts
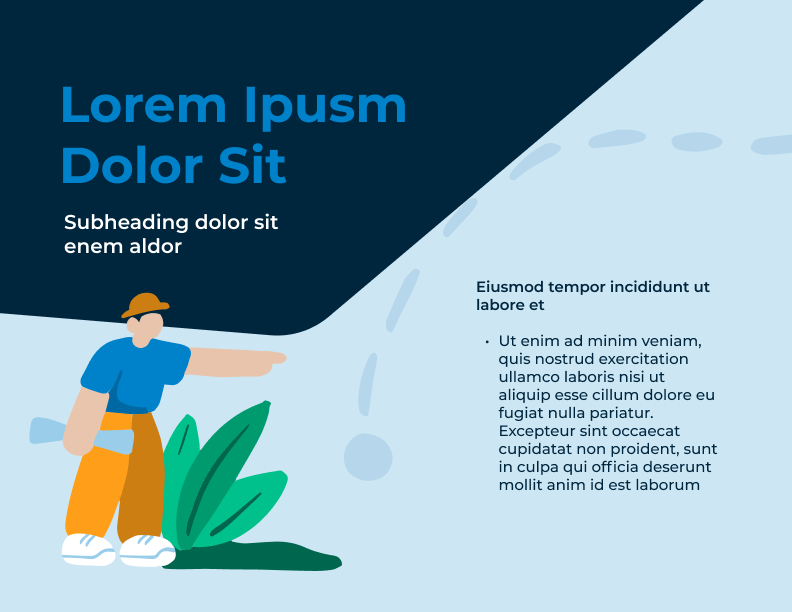

At the start of the project, one of the major hurdles we had to overcome was the illustration style. For most of our projects, there weren’t a lot of illustrations needed. Since this was going to live as a E-Book that people could access, we had it to make it visually appealing.
You can see some of the earlier concepts I had in creating the booklet. Layout, illustrations and colors were explored as we tried to stay close to our evolving brand guidelines.
Evolution &
Problem Solving

Some of the problems I had to solve while working with the lead designer were:
What visuals do we want to include on the different pages?
What style of illustrations do we want to use in the book (isometric look, a 2D or 3D look?)
How do we make the visuals used relevant to the page content?
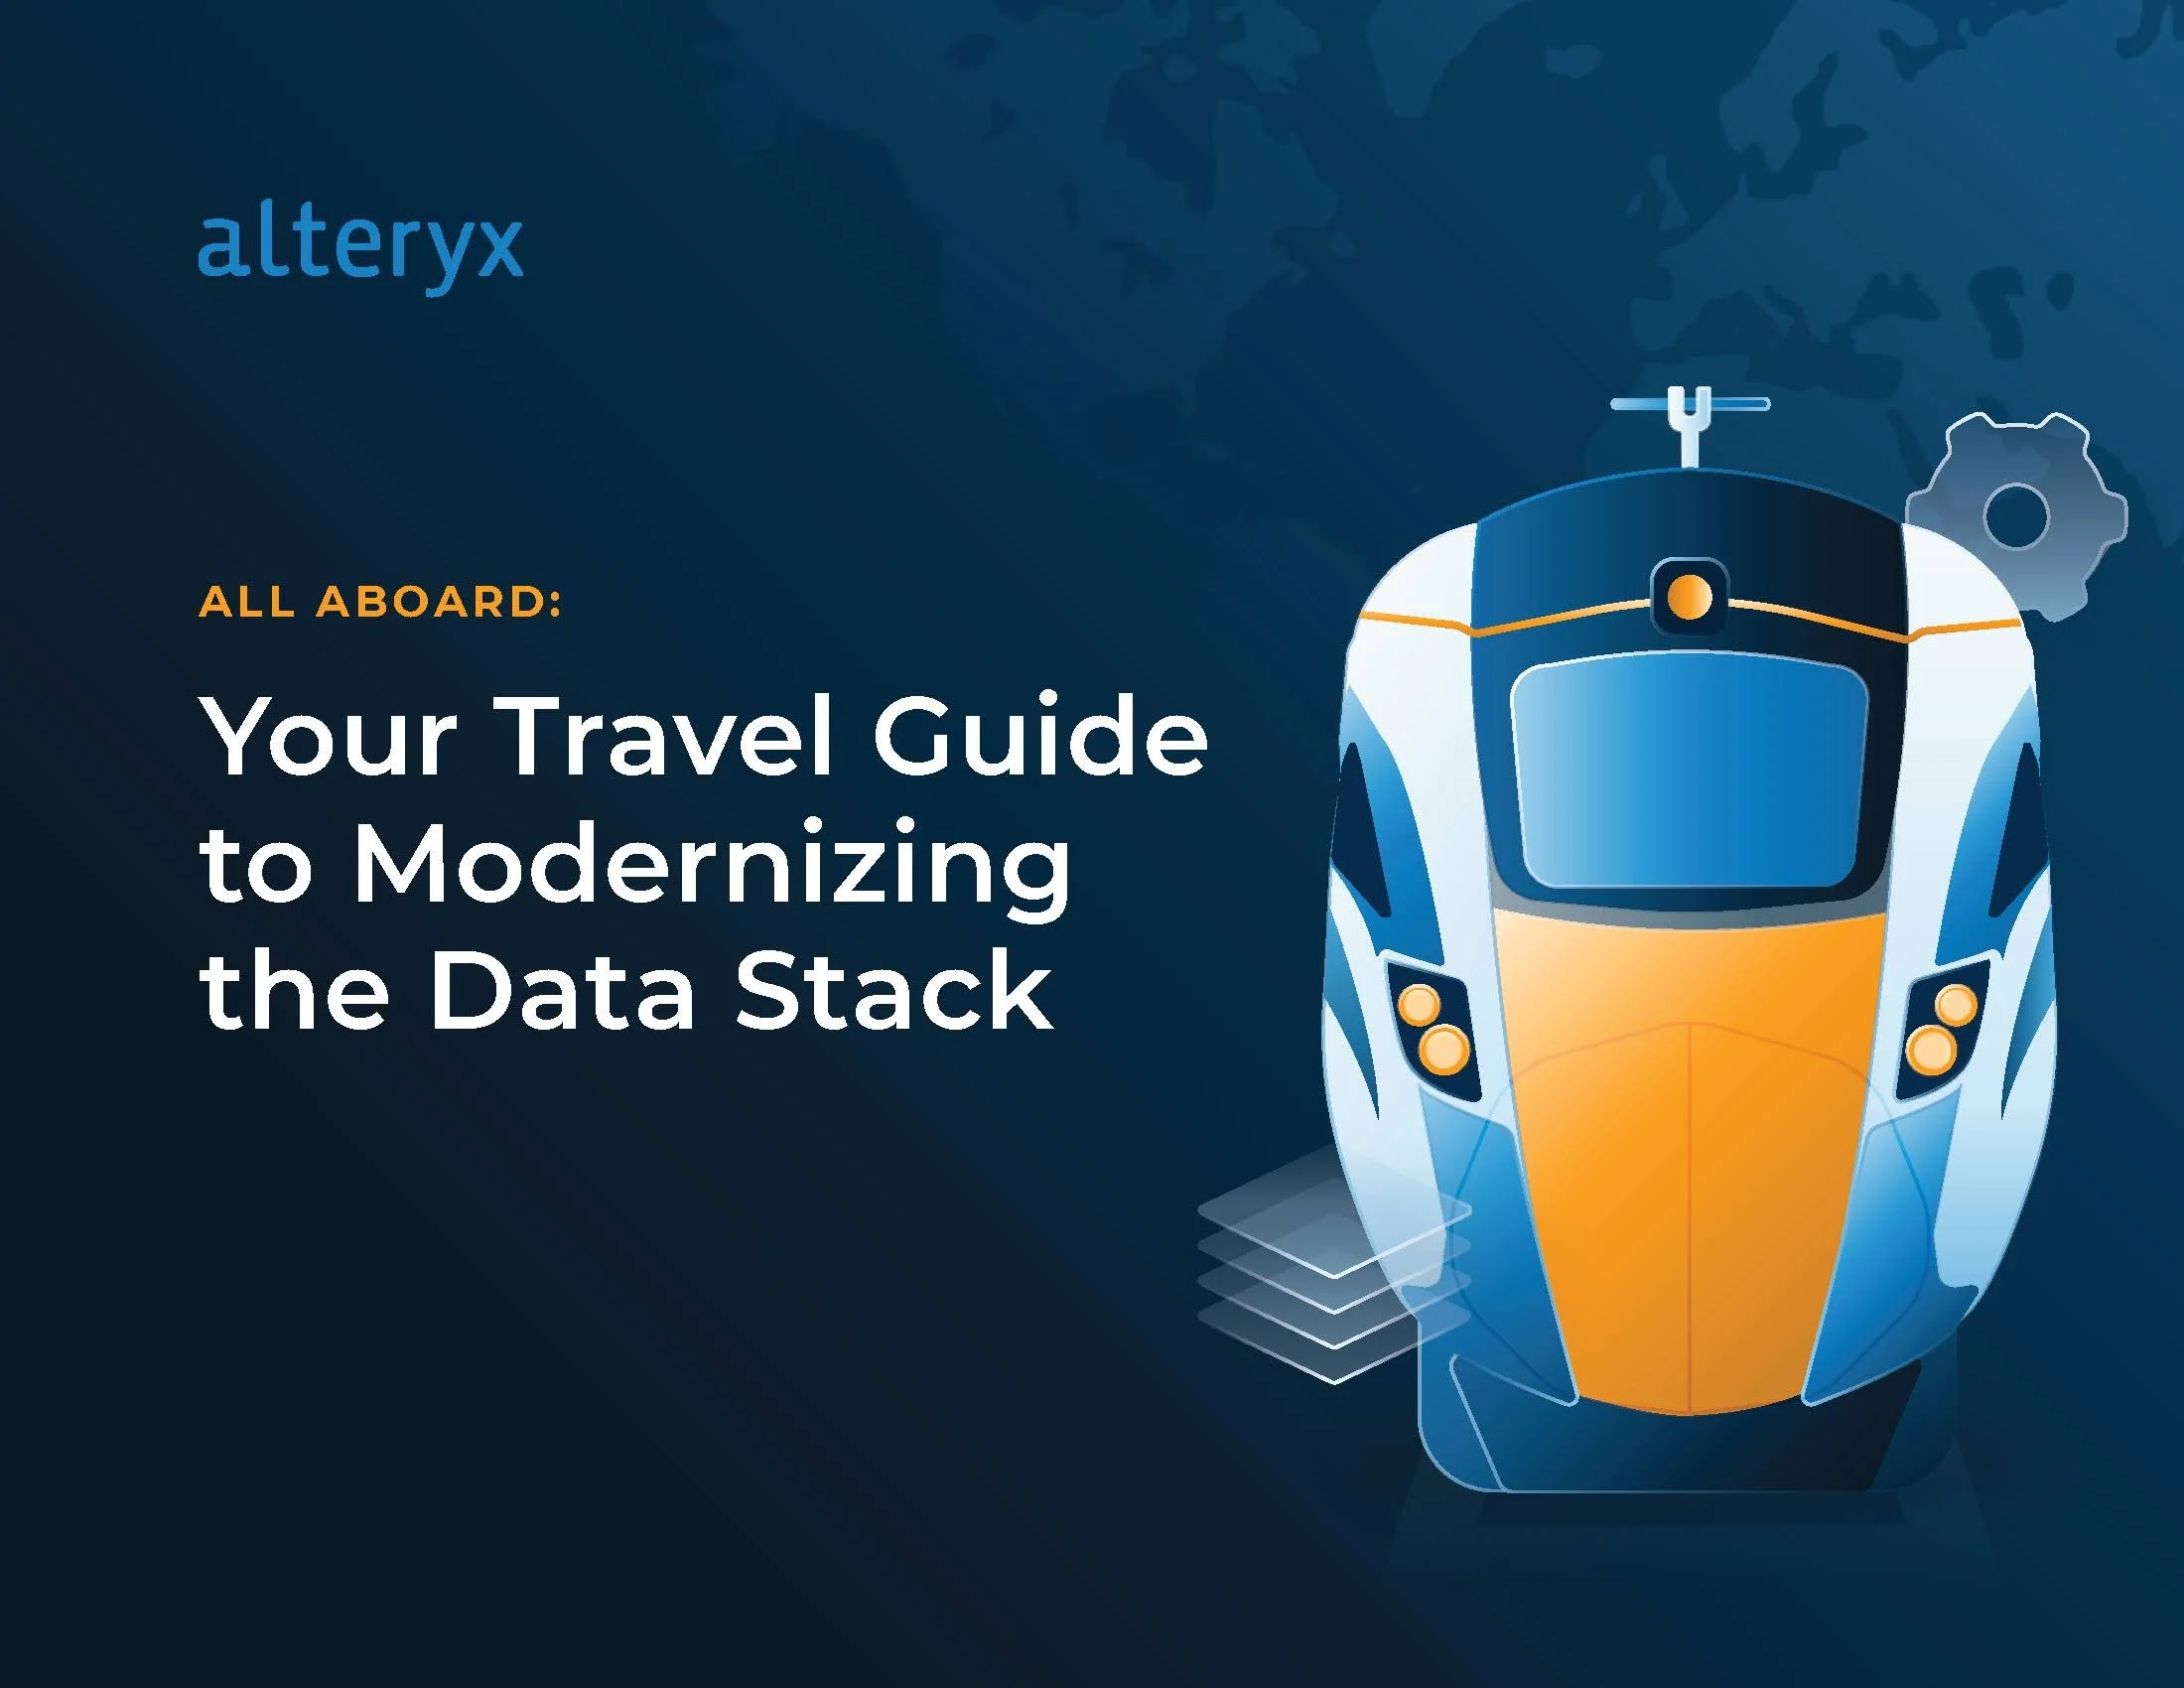
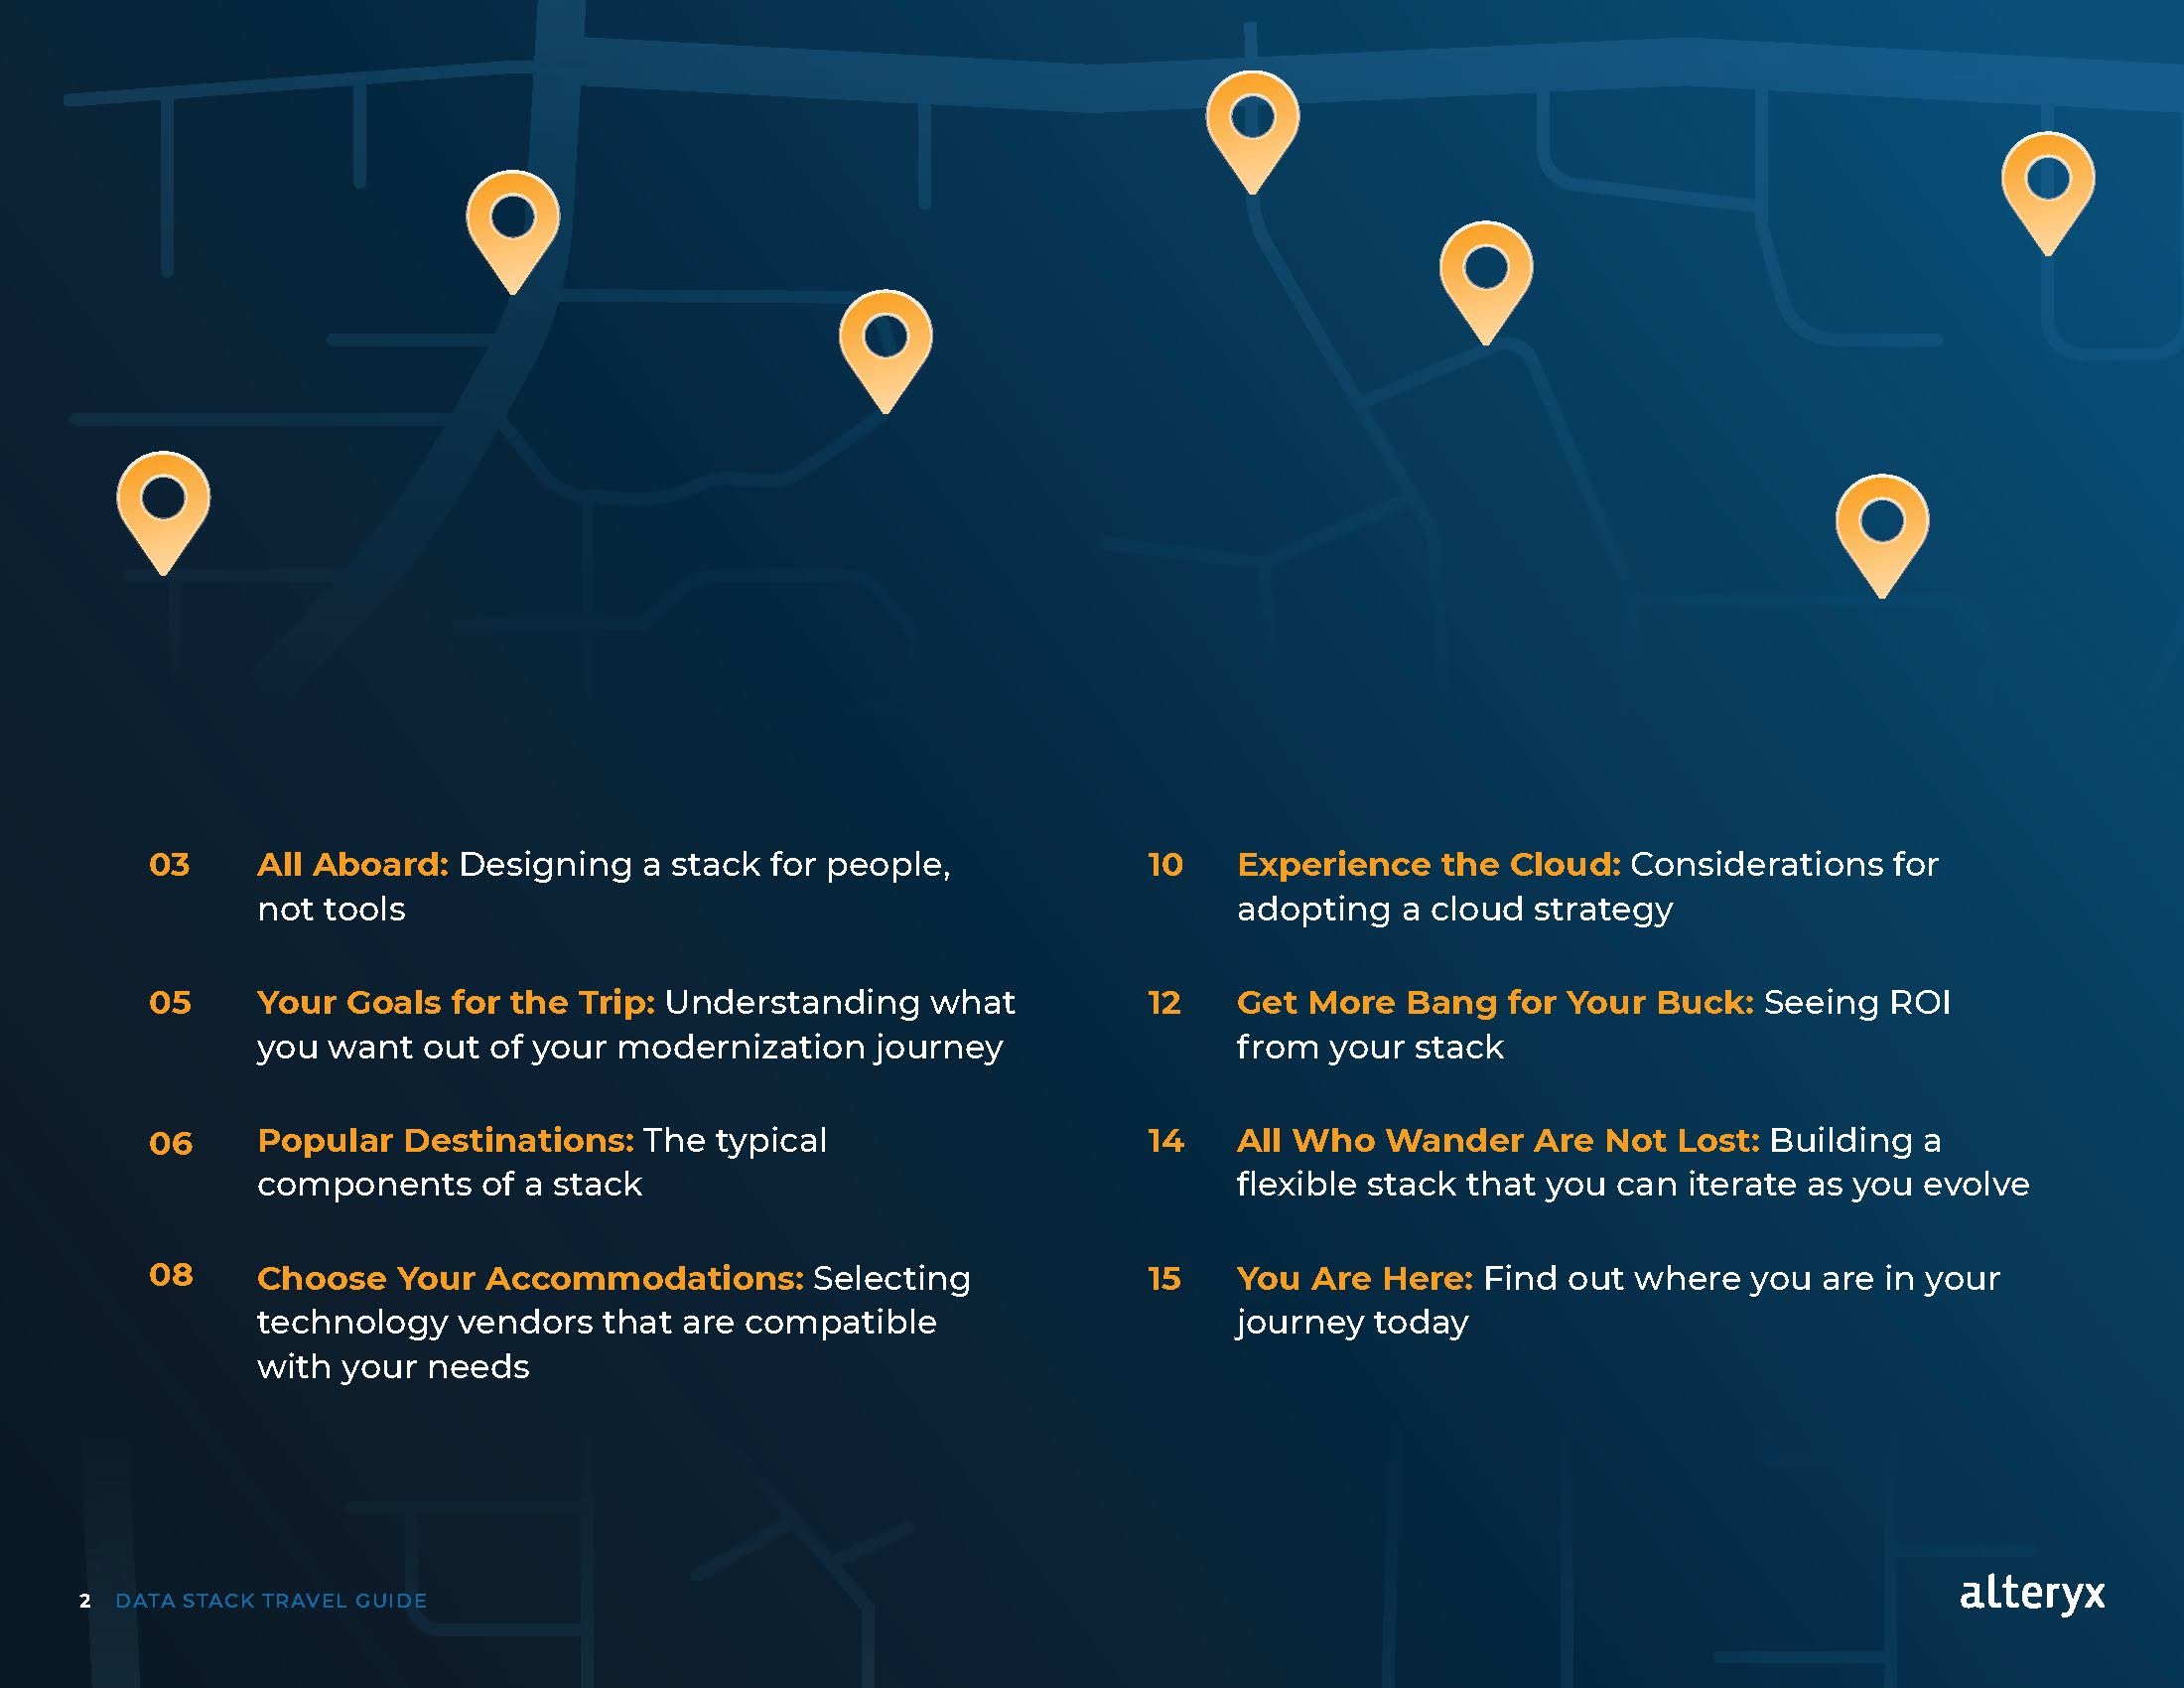
These problem solves helped us evolve the book into a finished piece that we were proud of. You can see the finished work below.


Social & Promos


From this project, we were able to align with our new style guide for illustration treatments.
Here’s more of the illustrations that have been used for other requests.


Overall, this project gave me great practice working in Illustrator to create the visuals used in this book. While there were some complex illustrations, it challenged me to explore solutions that we ended up using in the book.