Overview
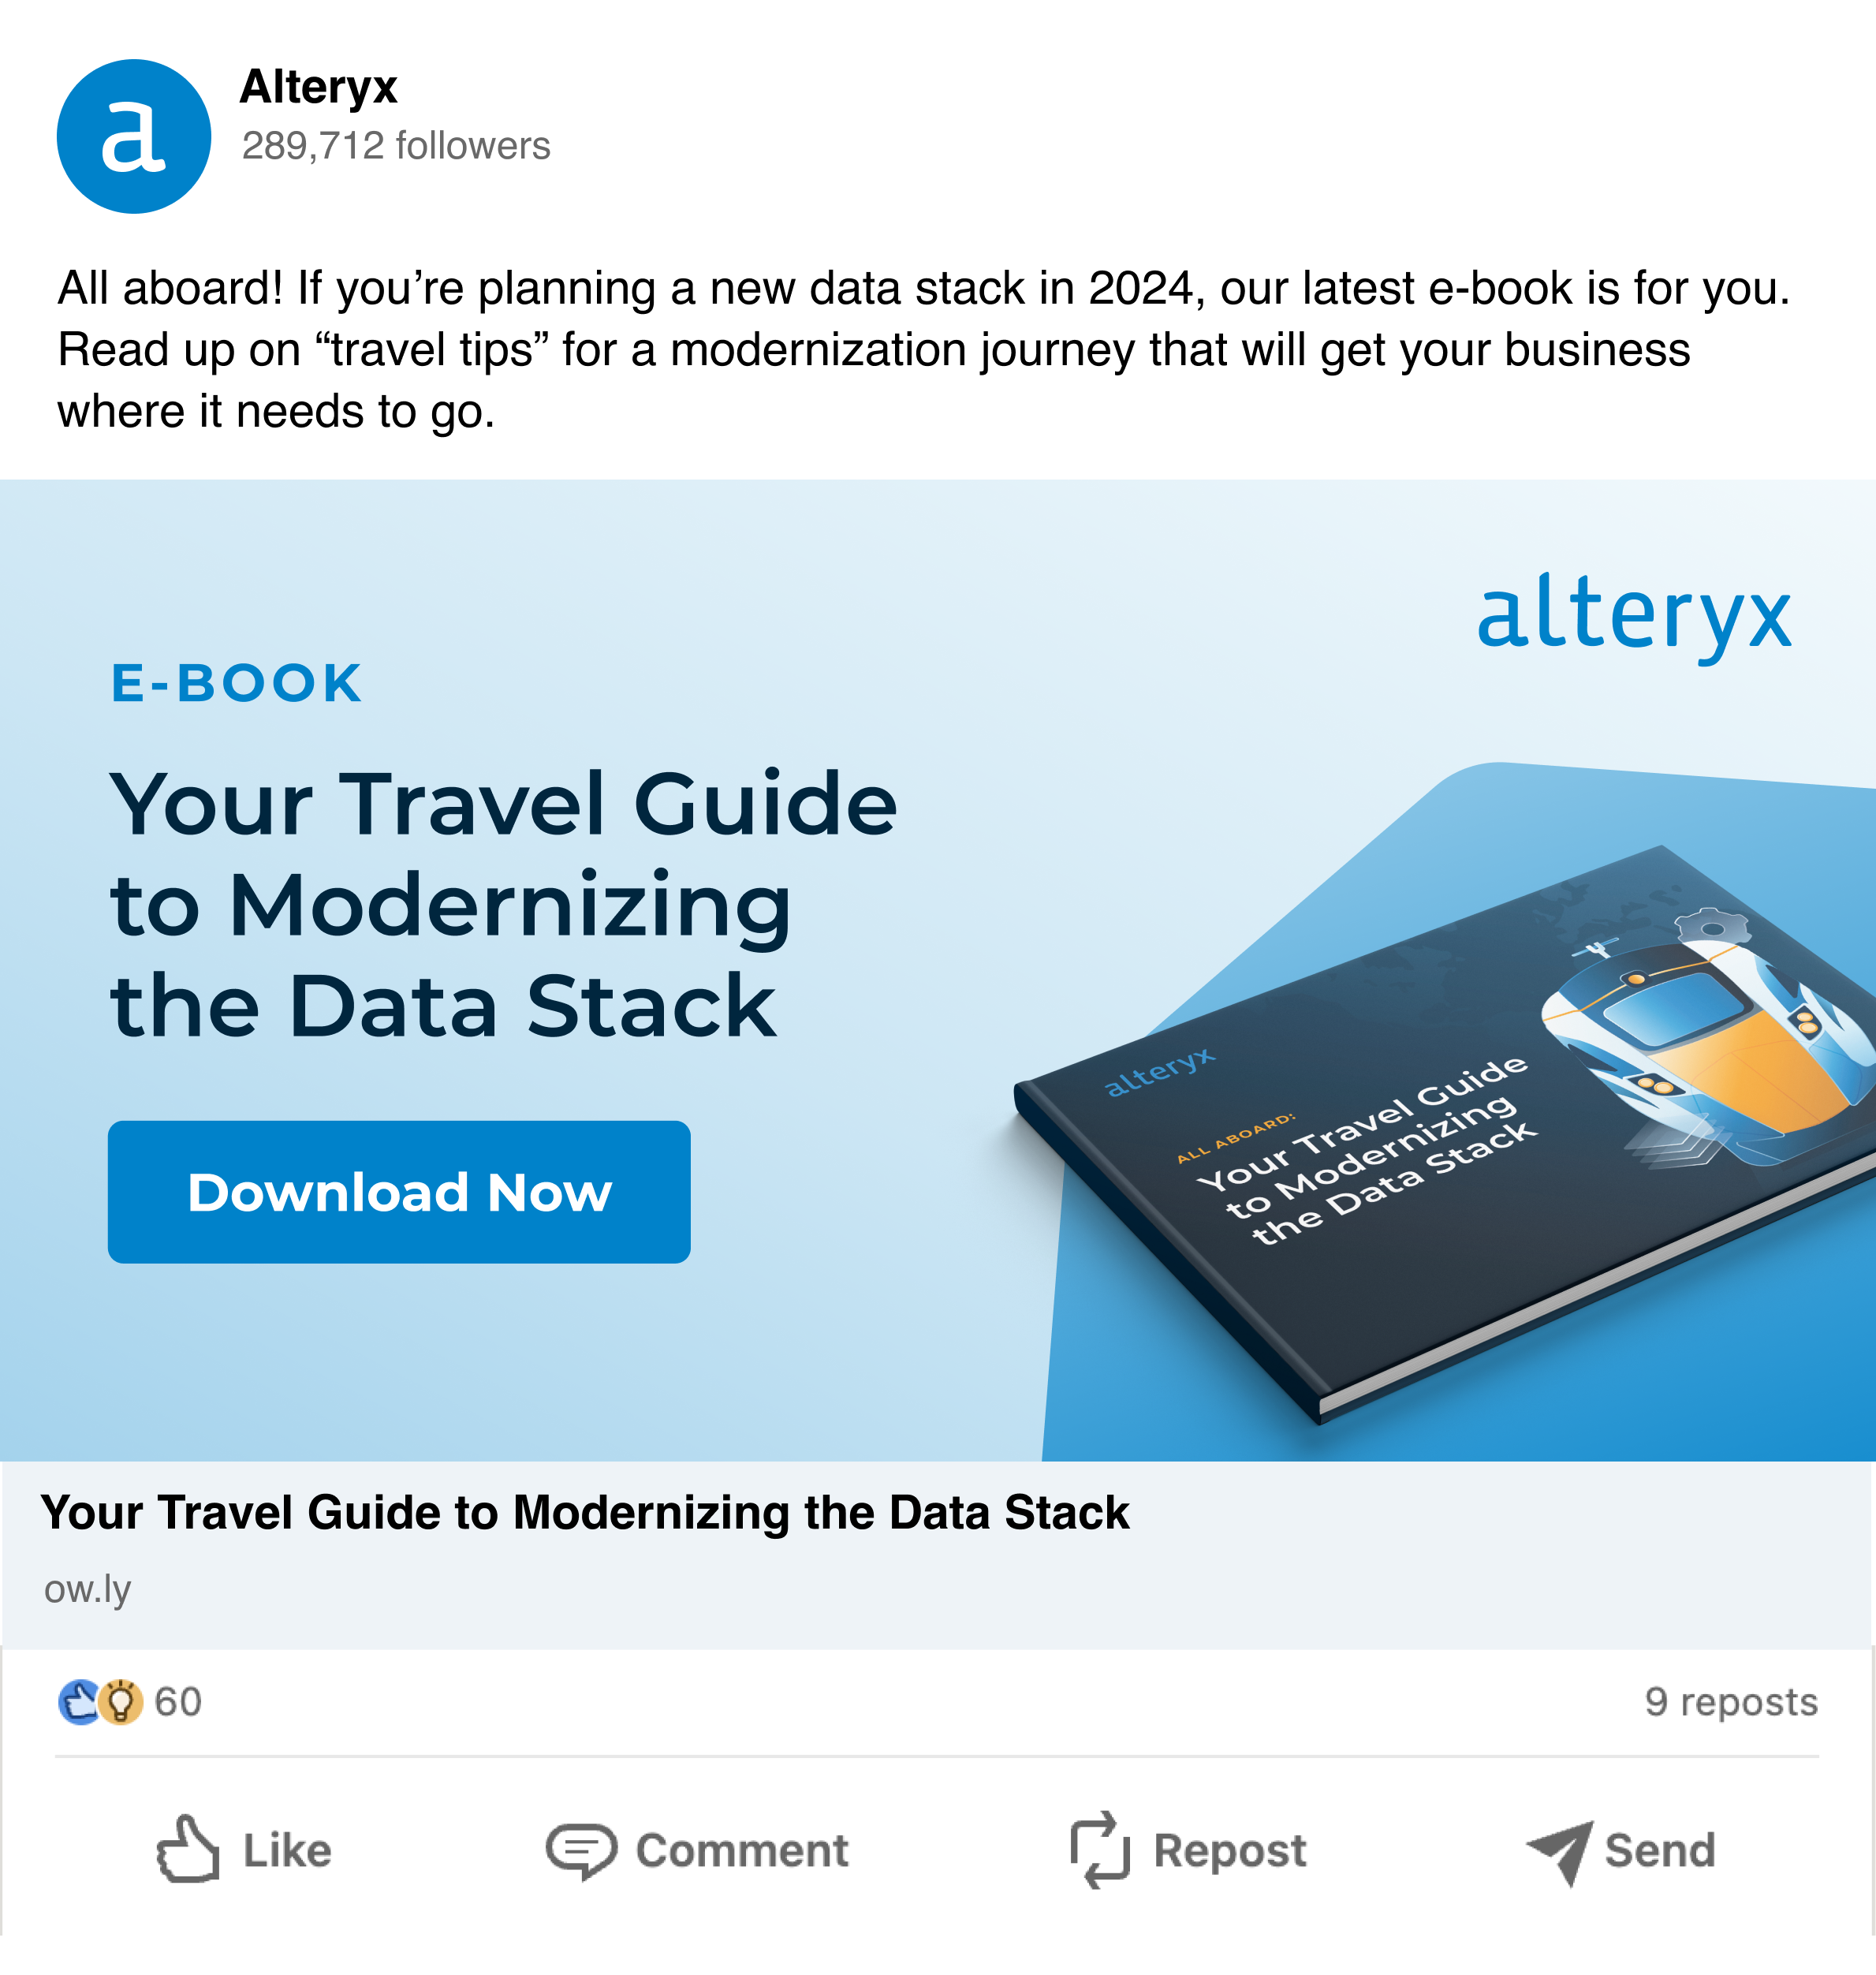
For one of my projects at Alteryx, I worked with our lead visual designer to create an immersive booklet. The goal of the project was to inform our users about how to plan a data stack, similar to how you plan a vacation.

Task
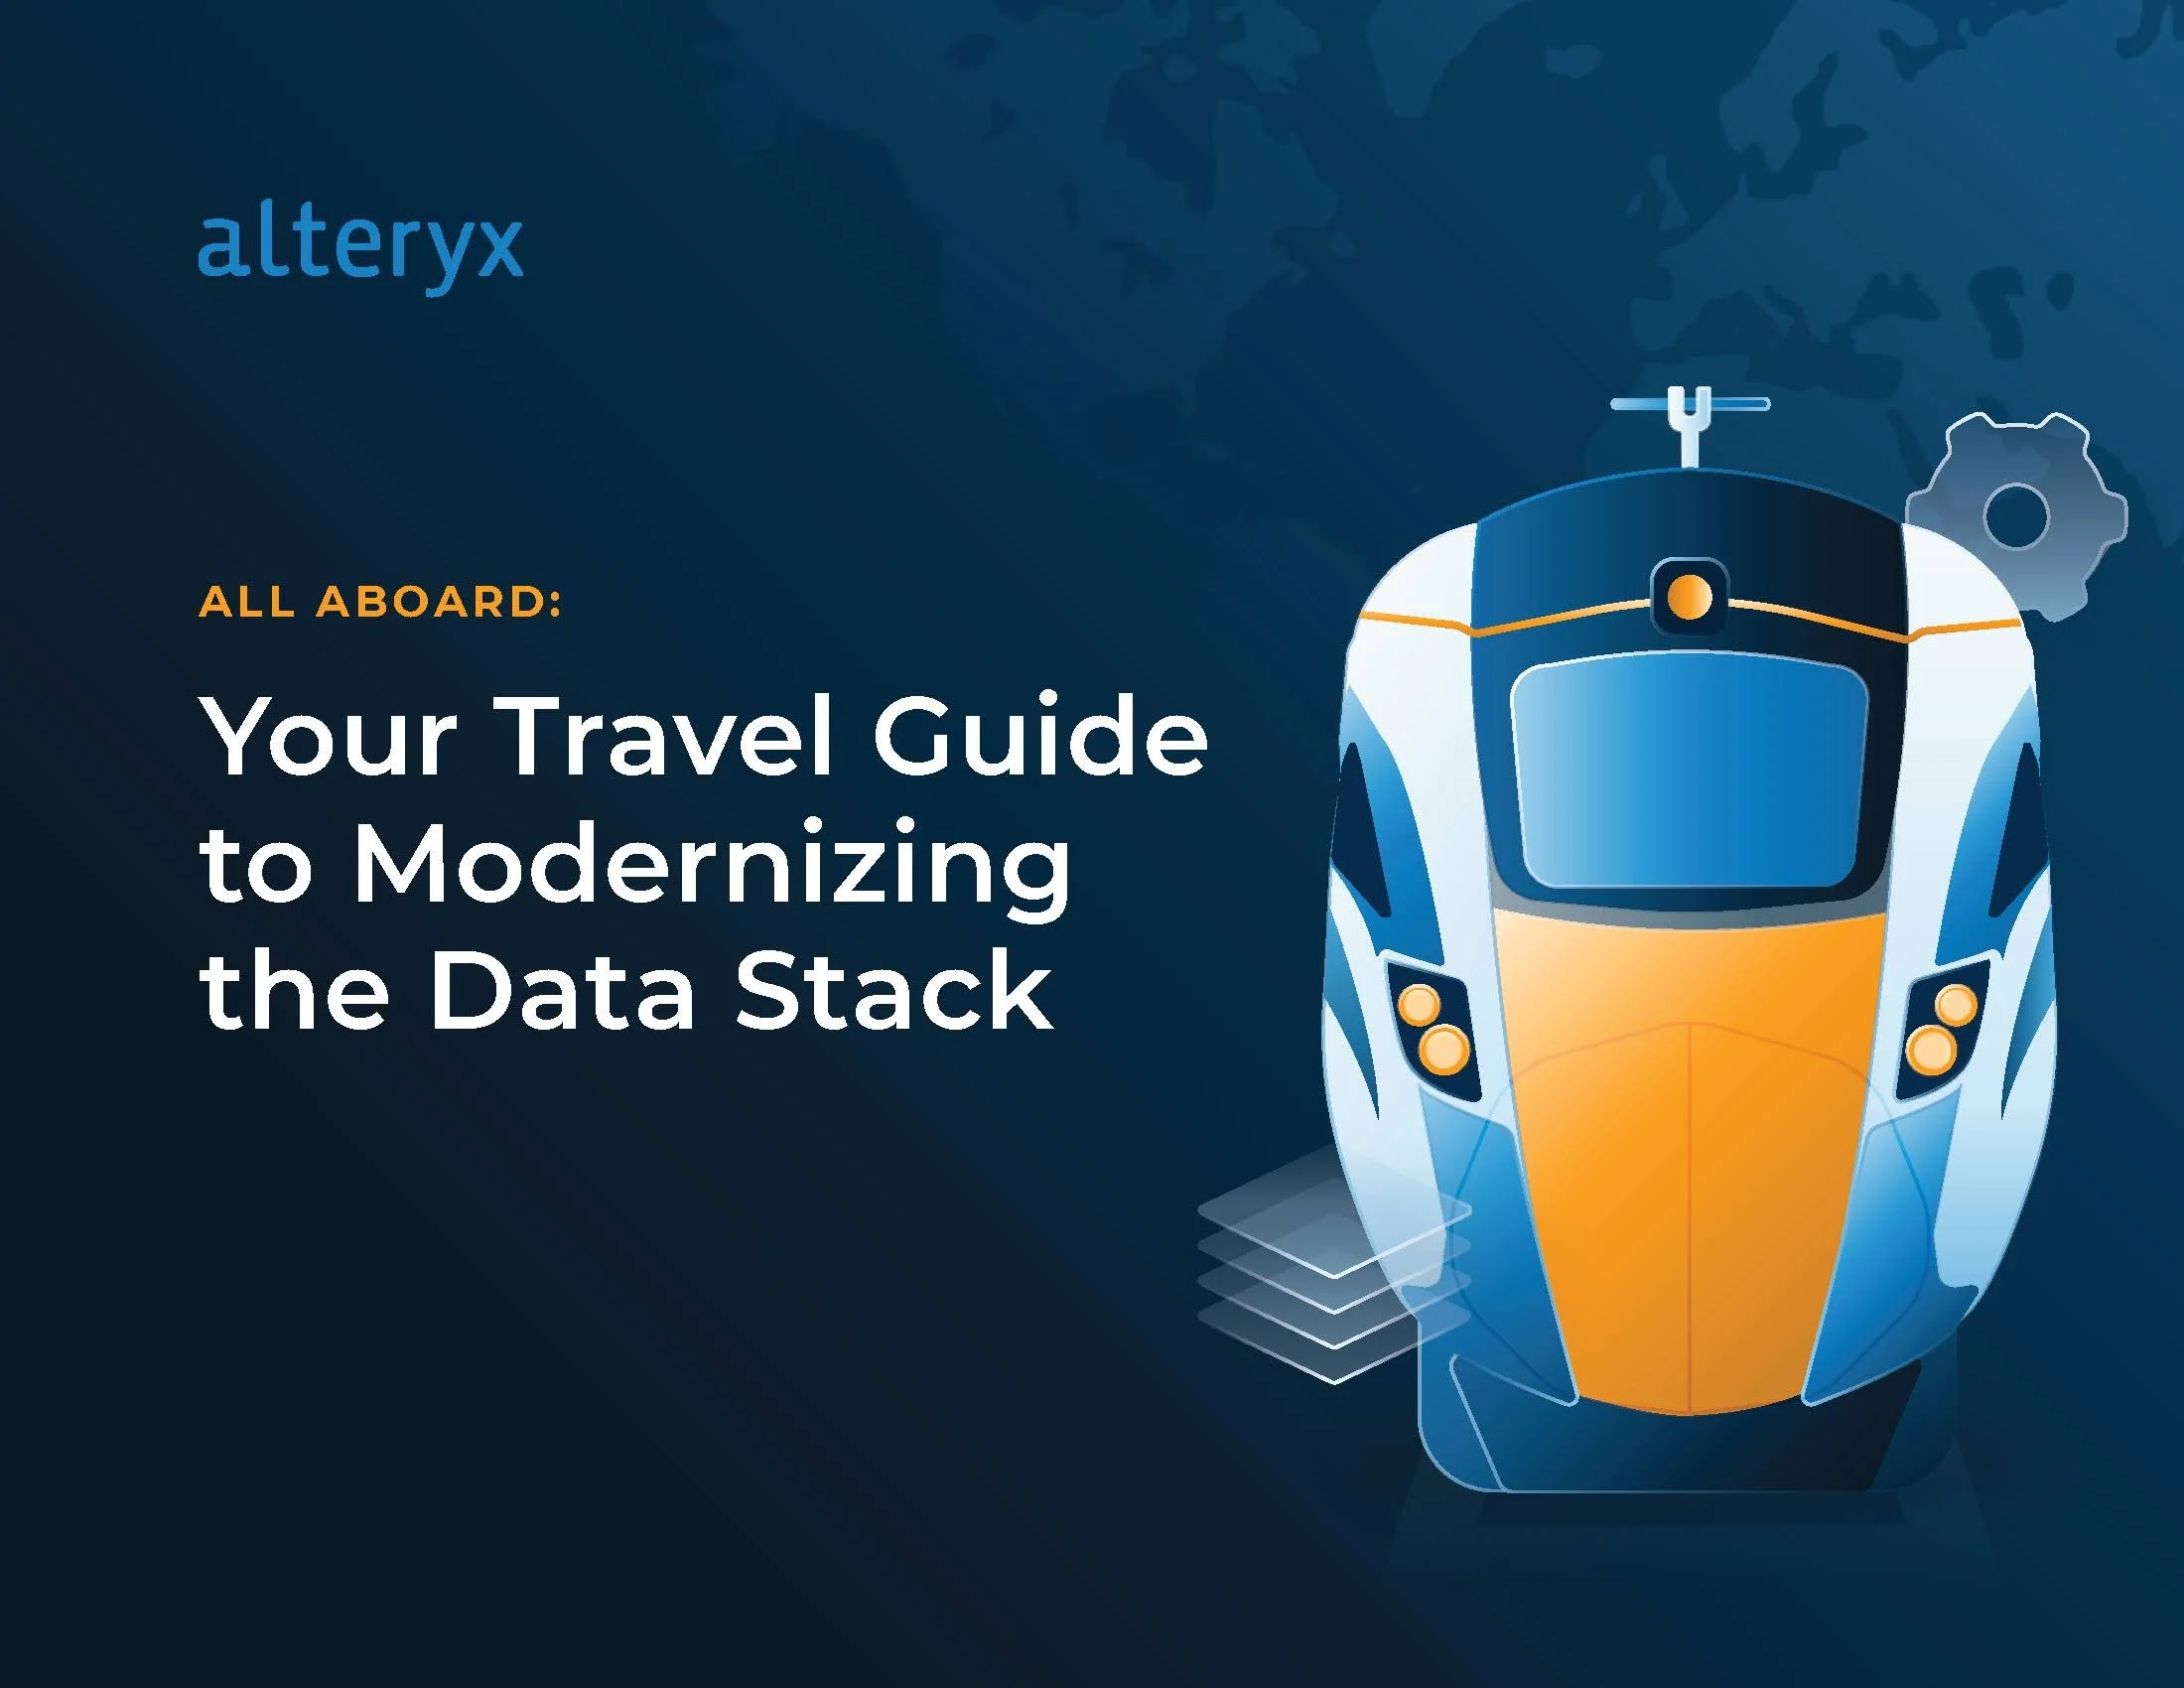
I was tasked with creating an E-book that mimics a travel guide with relevant imagery on optimizing your data stack for business. I explored different options for different imagery in our booklet (like maps, trains, binoculars, etc).
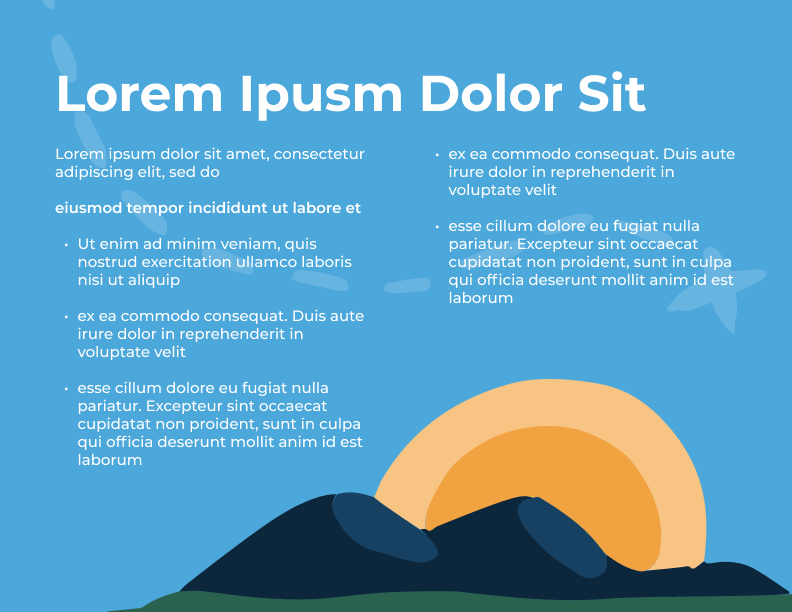
The images on the right were one of the concepts I proposed. It was an earlier draft, but the idea was to incorporate a Memphis Corporate Style and a hybrid of our elements for a fun booklet.

While we had to update our branding, one issue we ran into was creating an illustration guide. What was important in the guide was how to best style images, what to include, and how we wanted to present it with the information. As I created images for the book, I had to implement those changes which meant going through many revisions.
Some of the problems I had to solve while working under the visual designer were:
What images do we want to include for different pages?
What style do we want to portray in the book (did we want an isometric look, a 2D or 3D look?)
How do we make the images relevant to the page content?
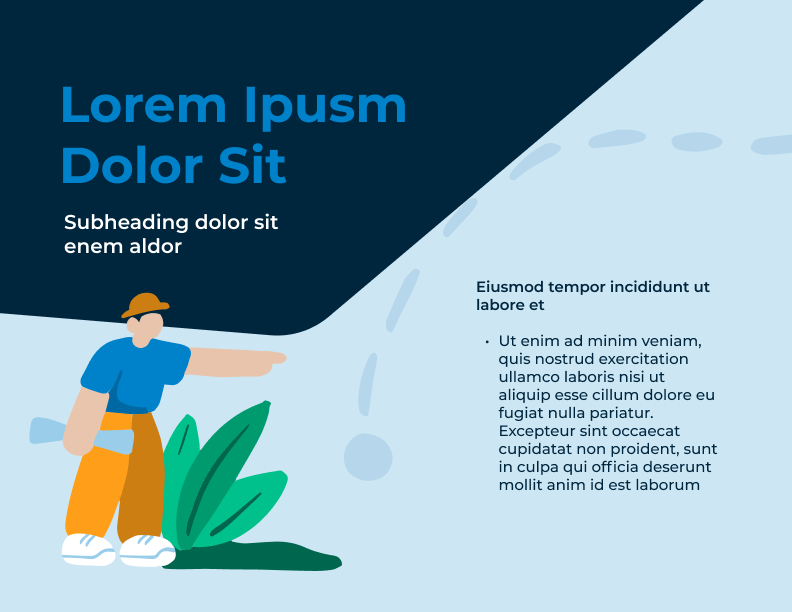
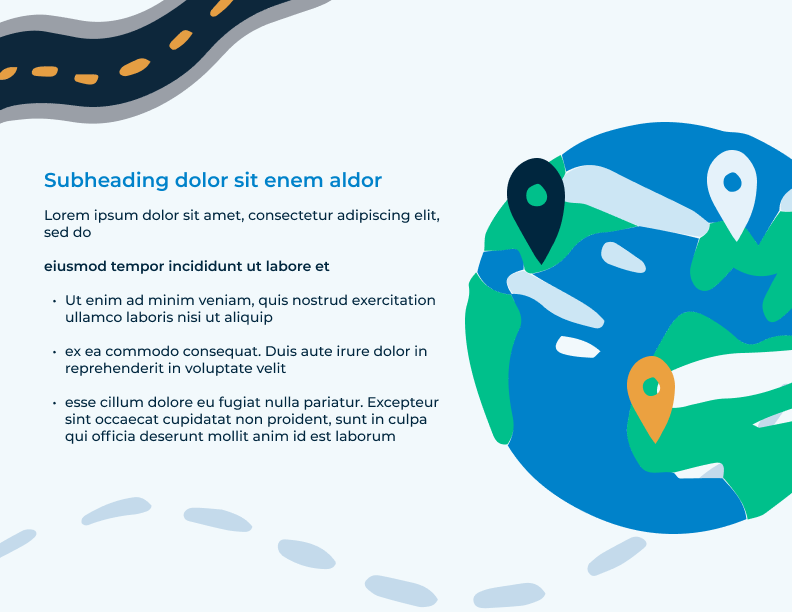
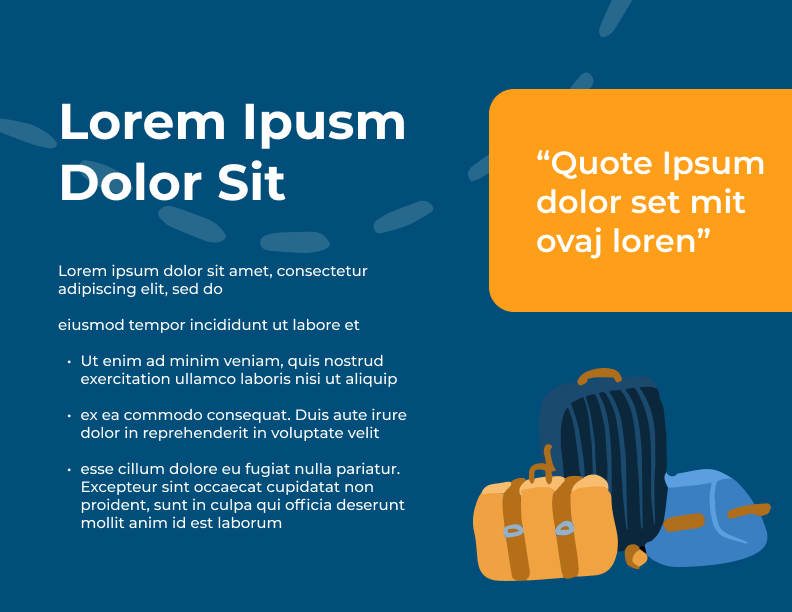
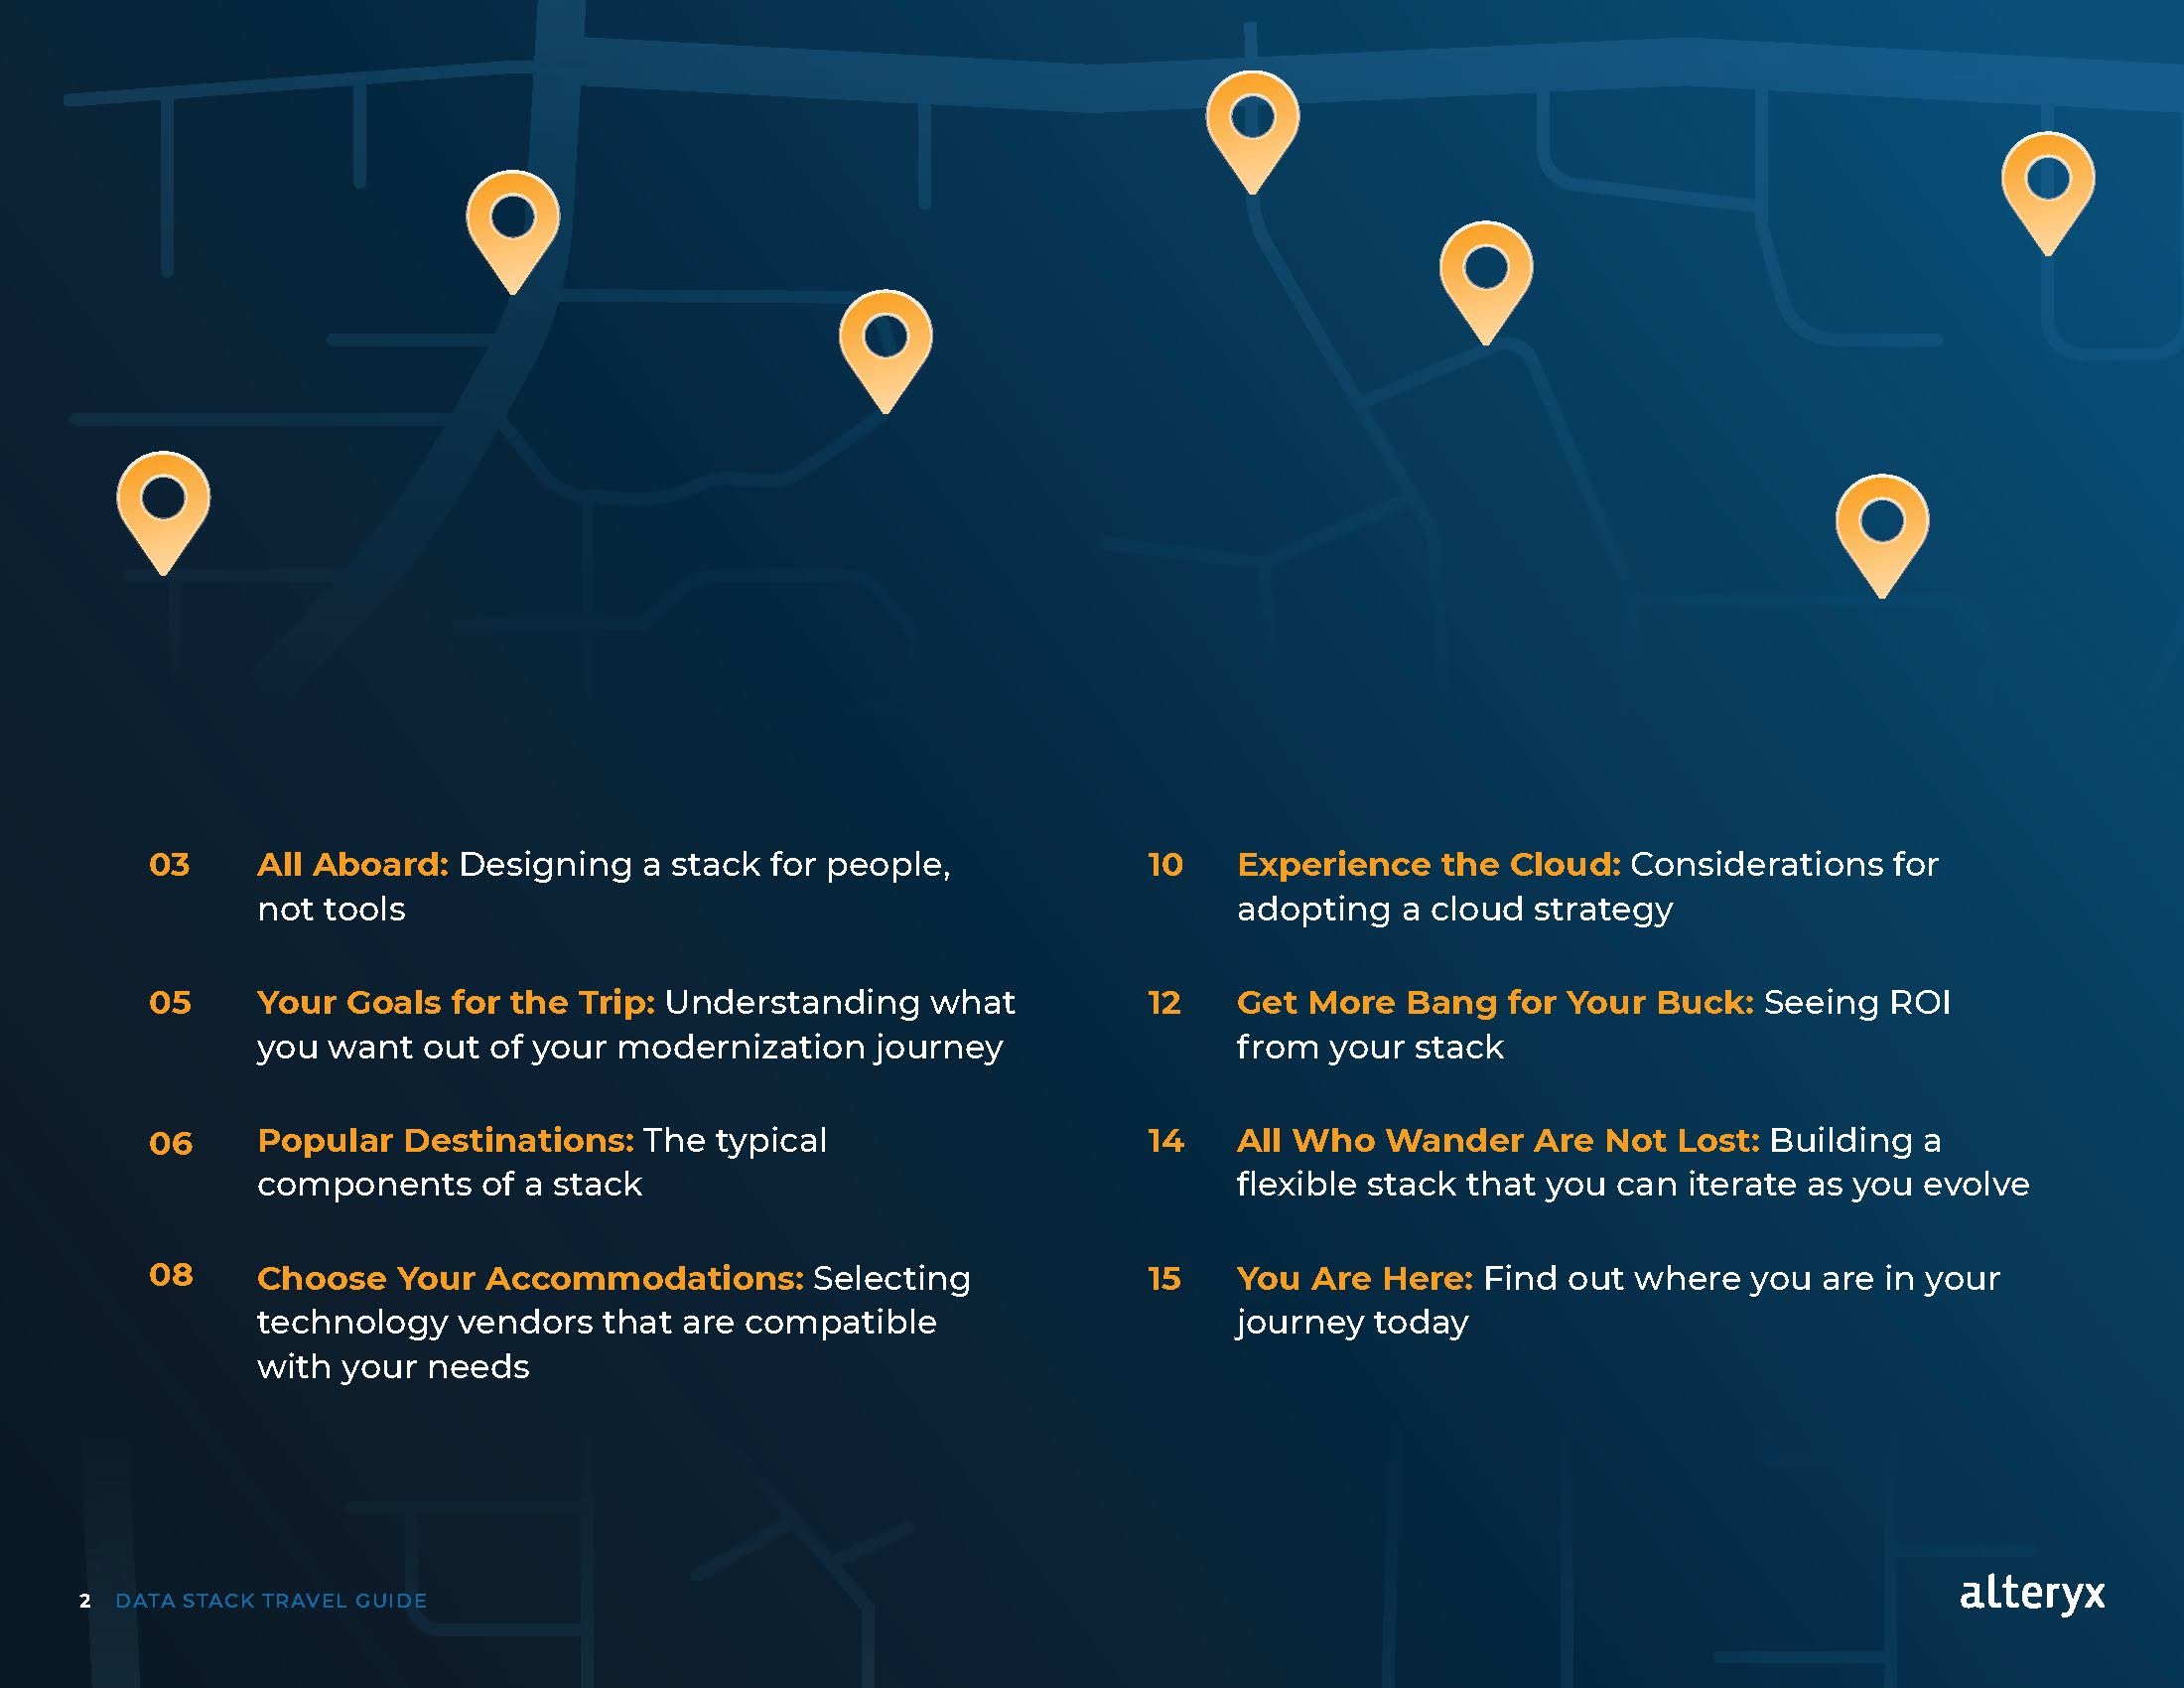
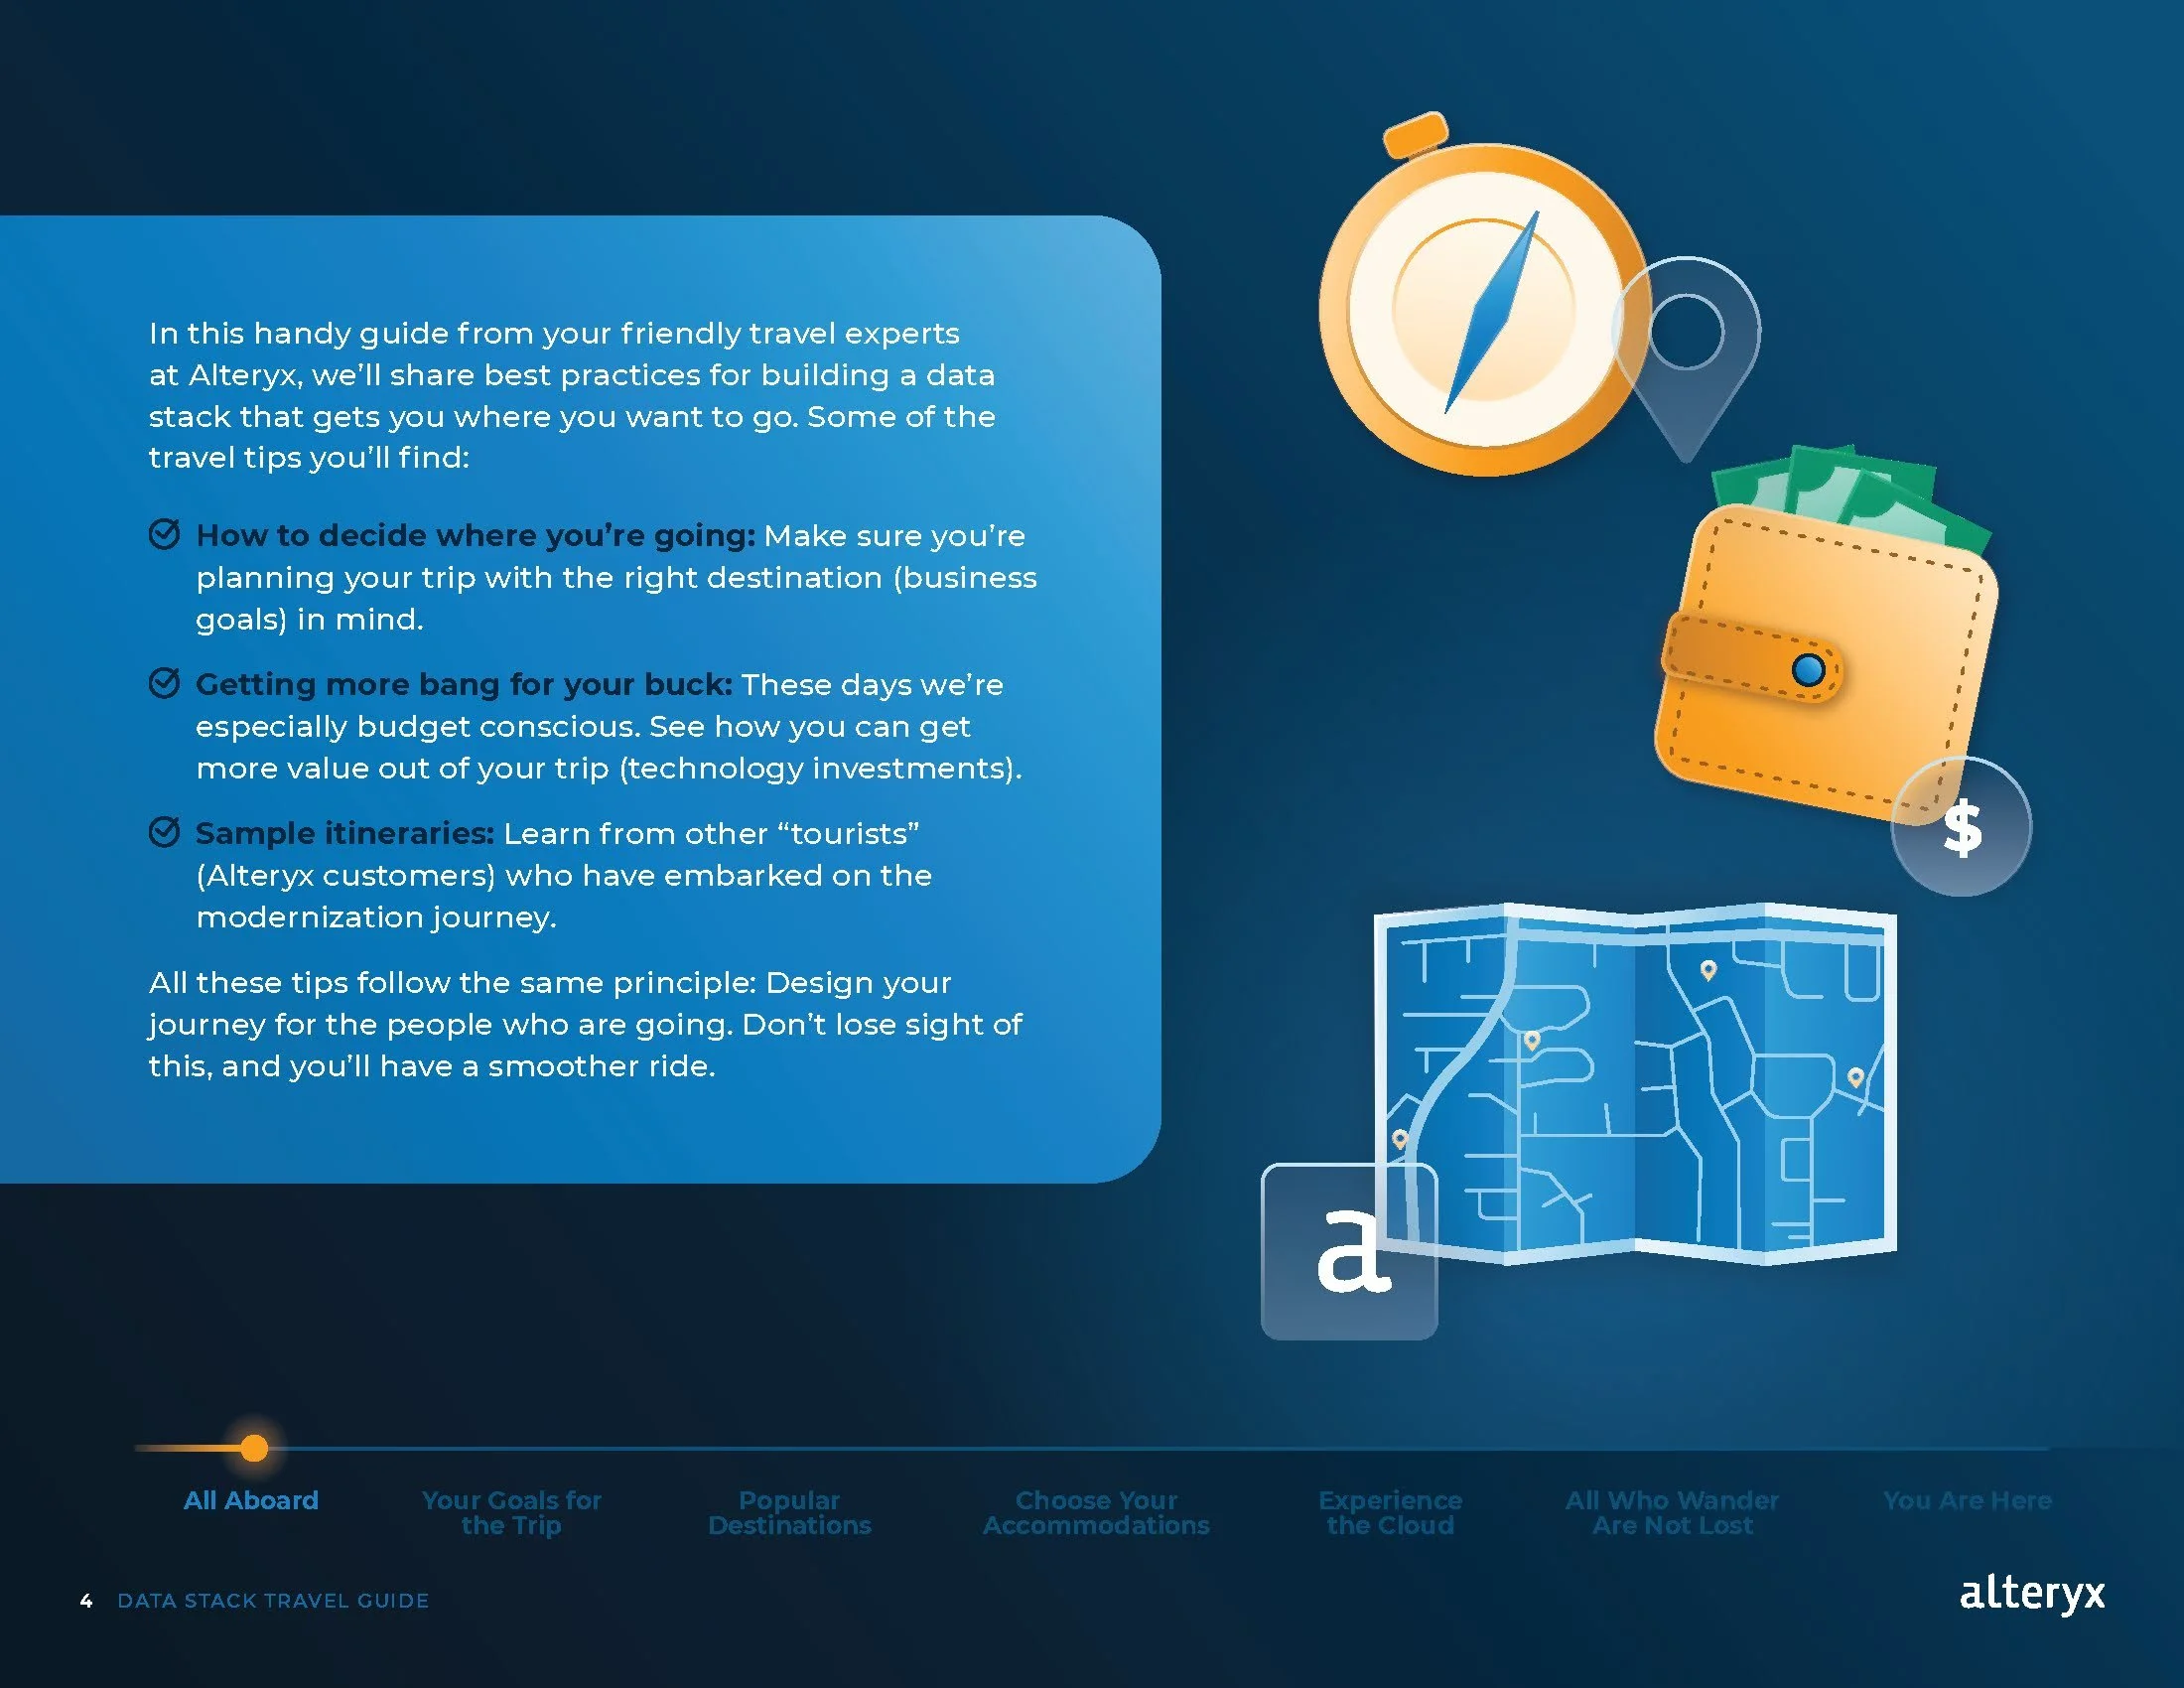
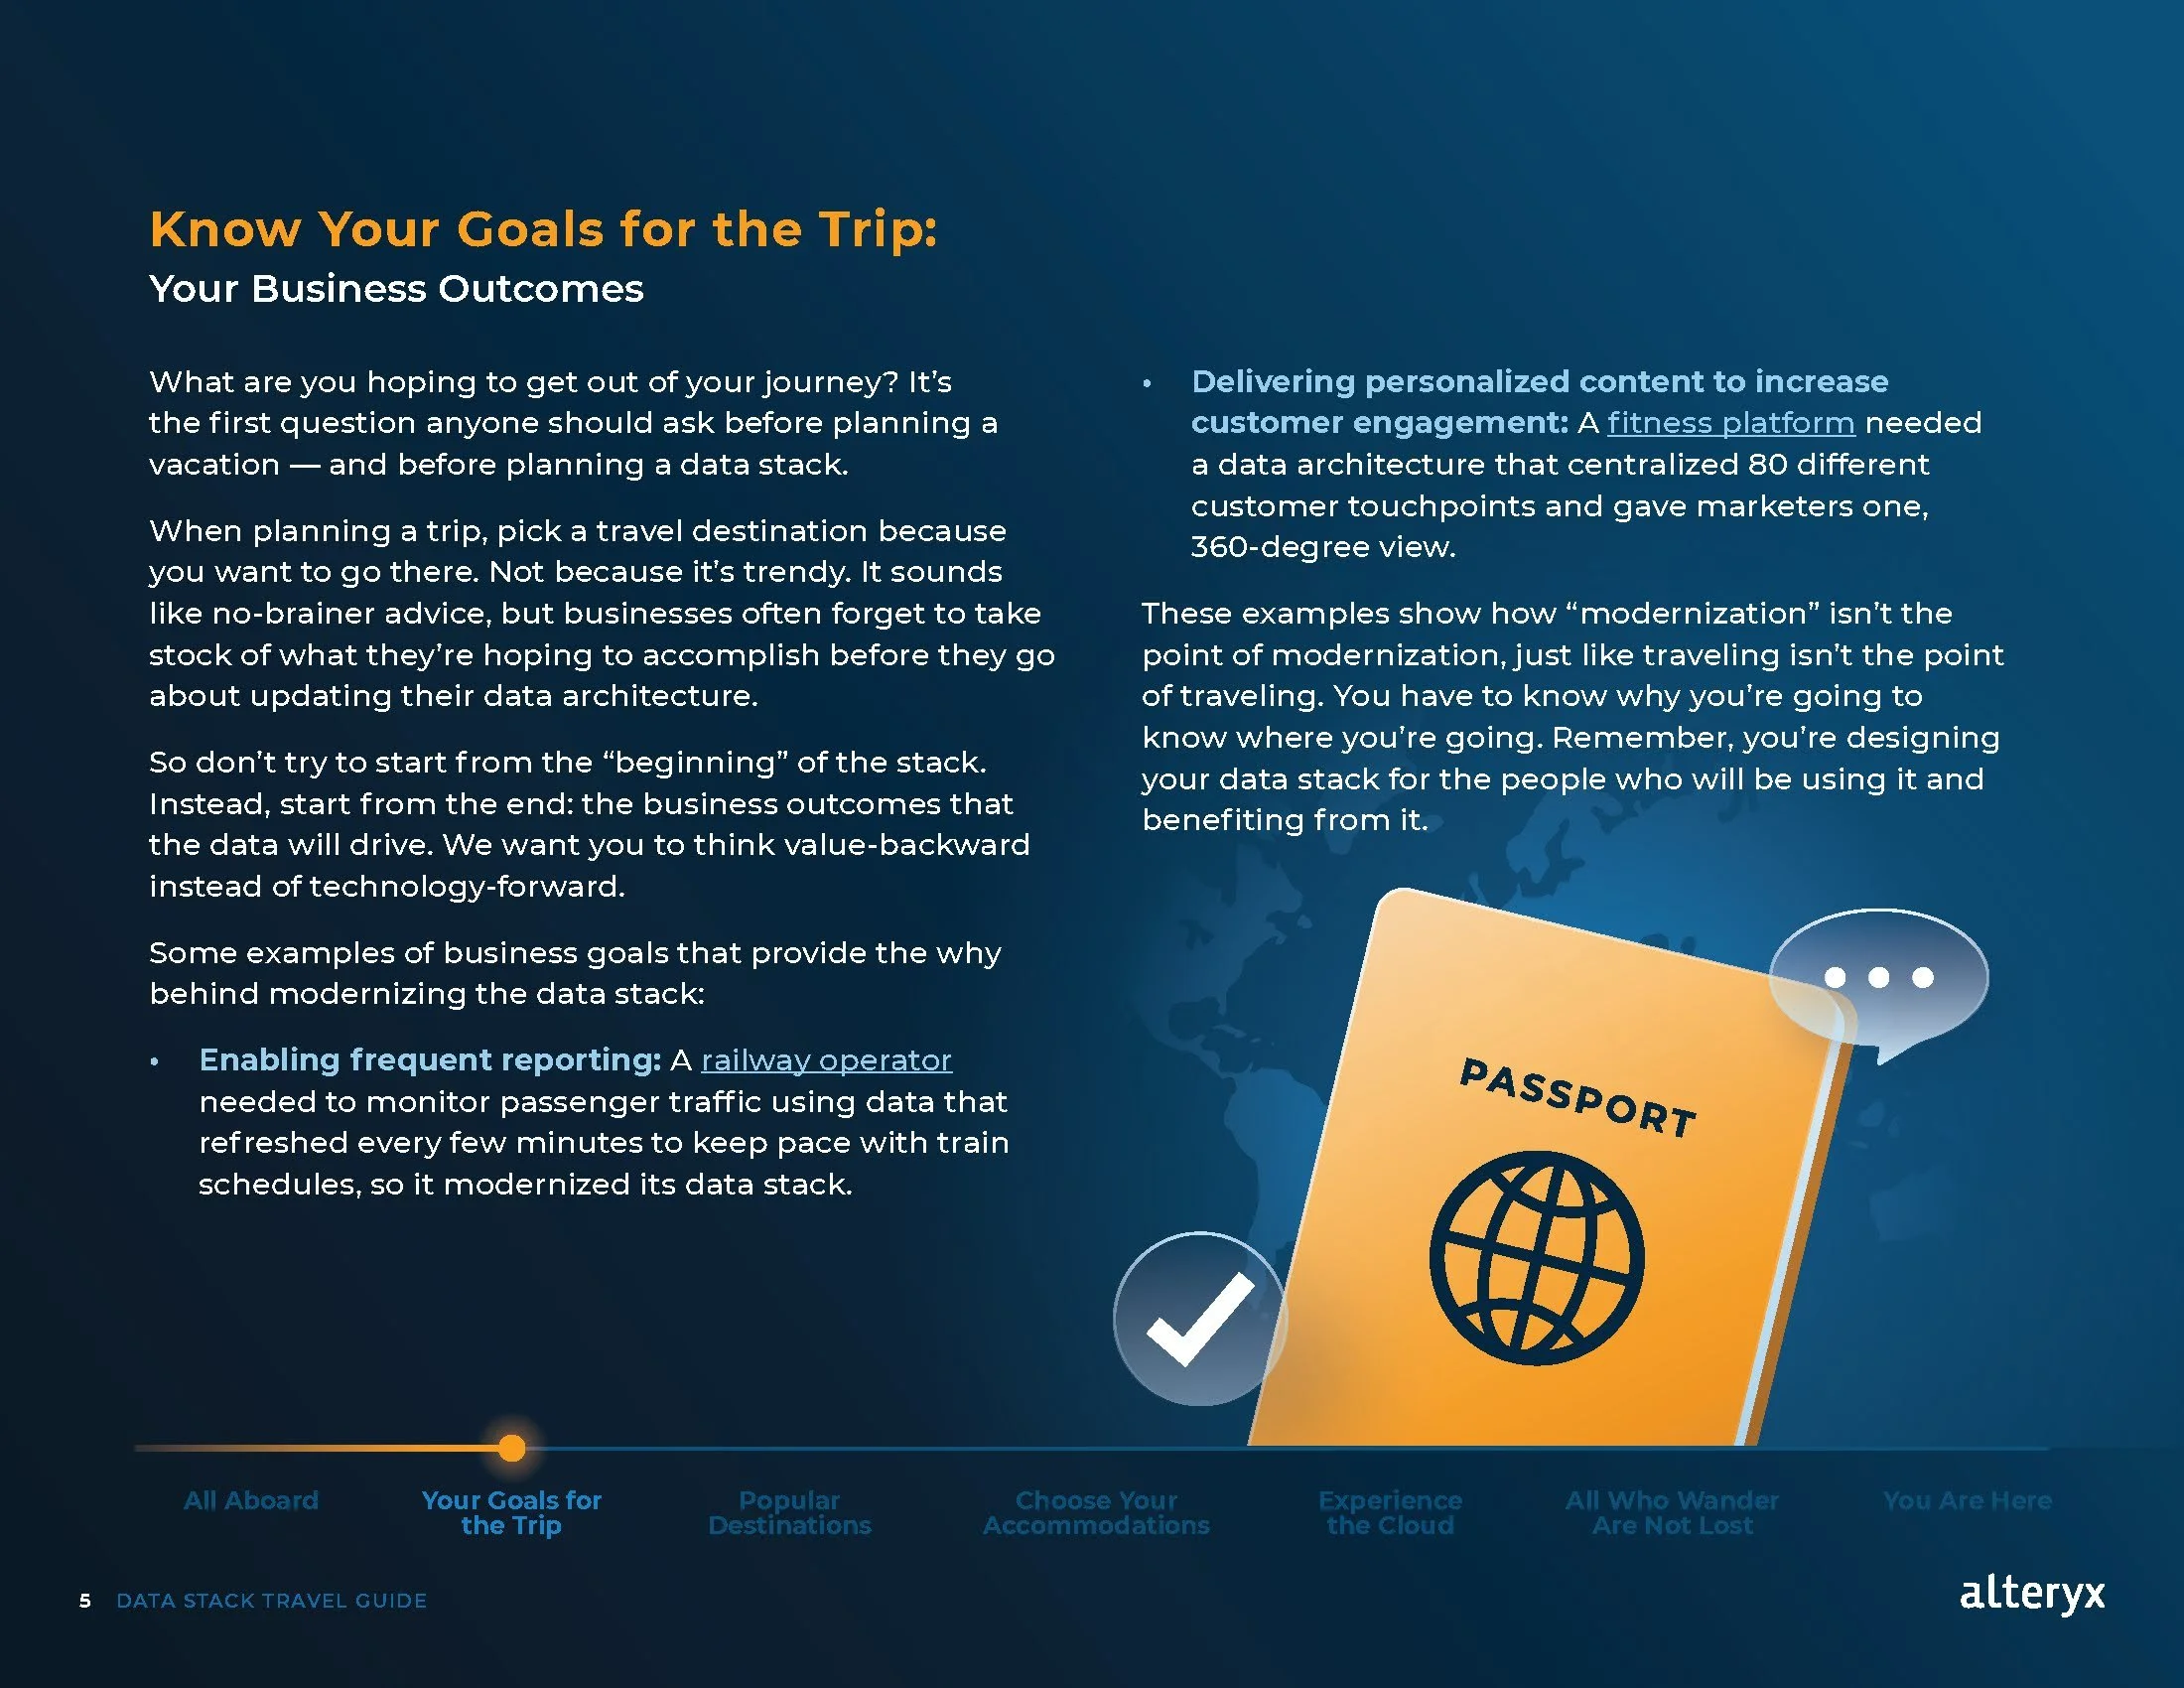
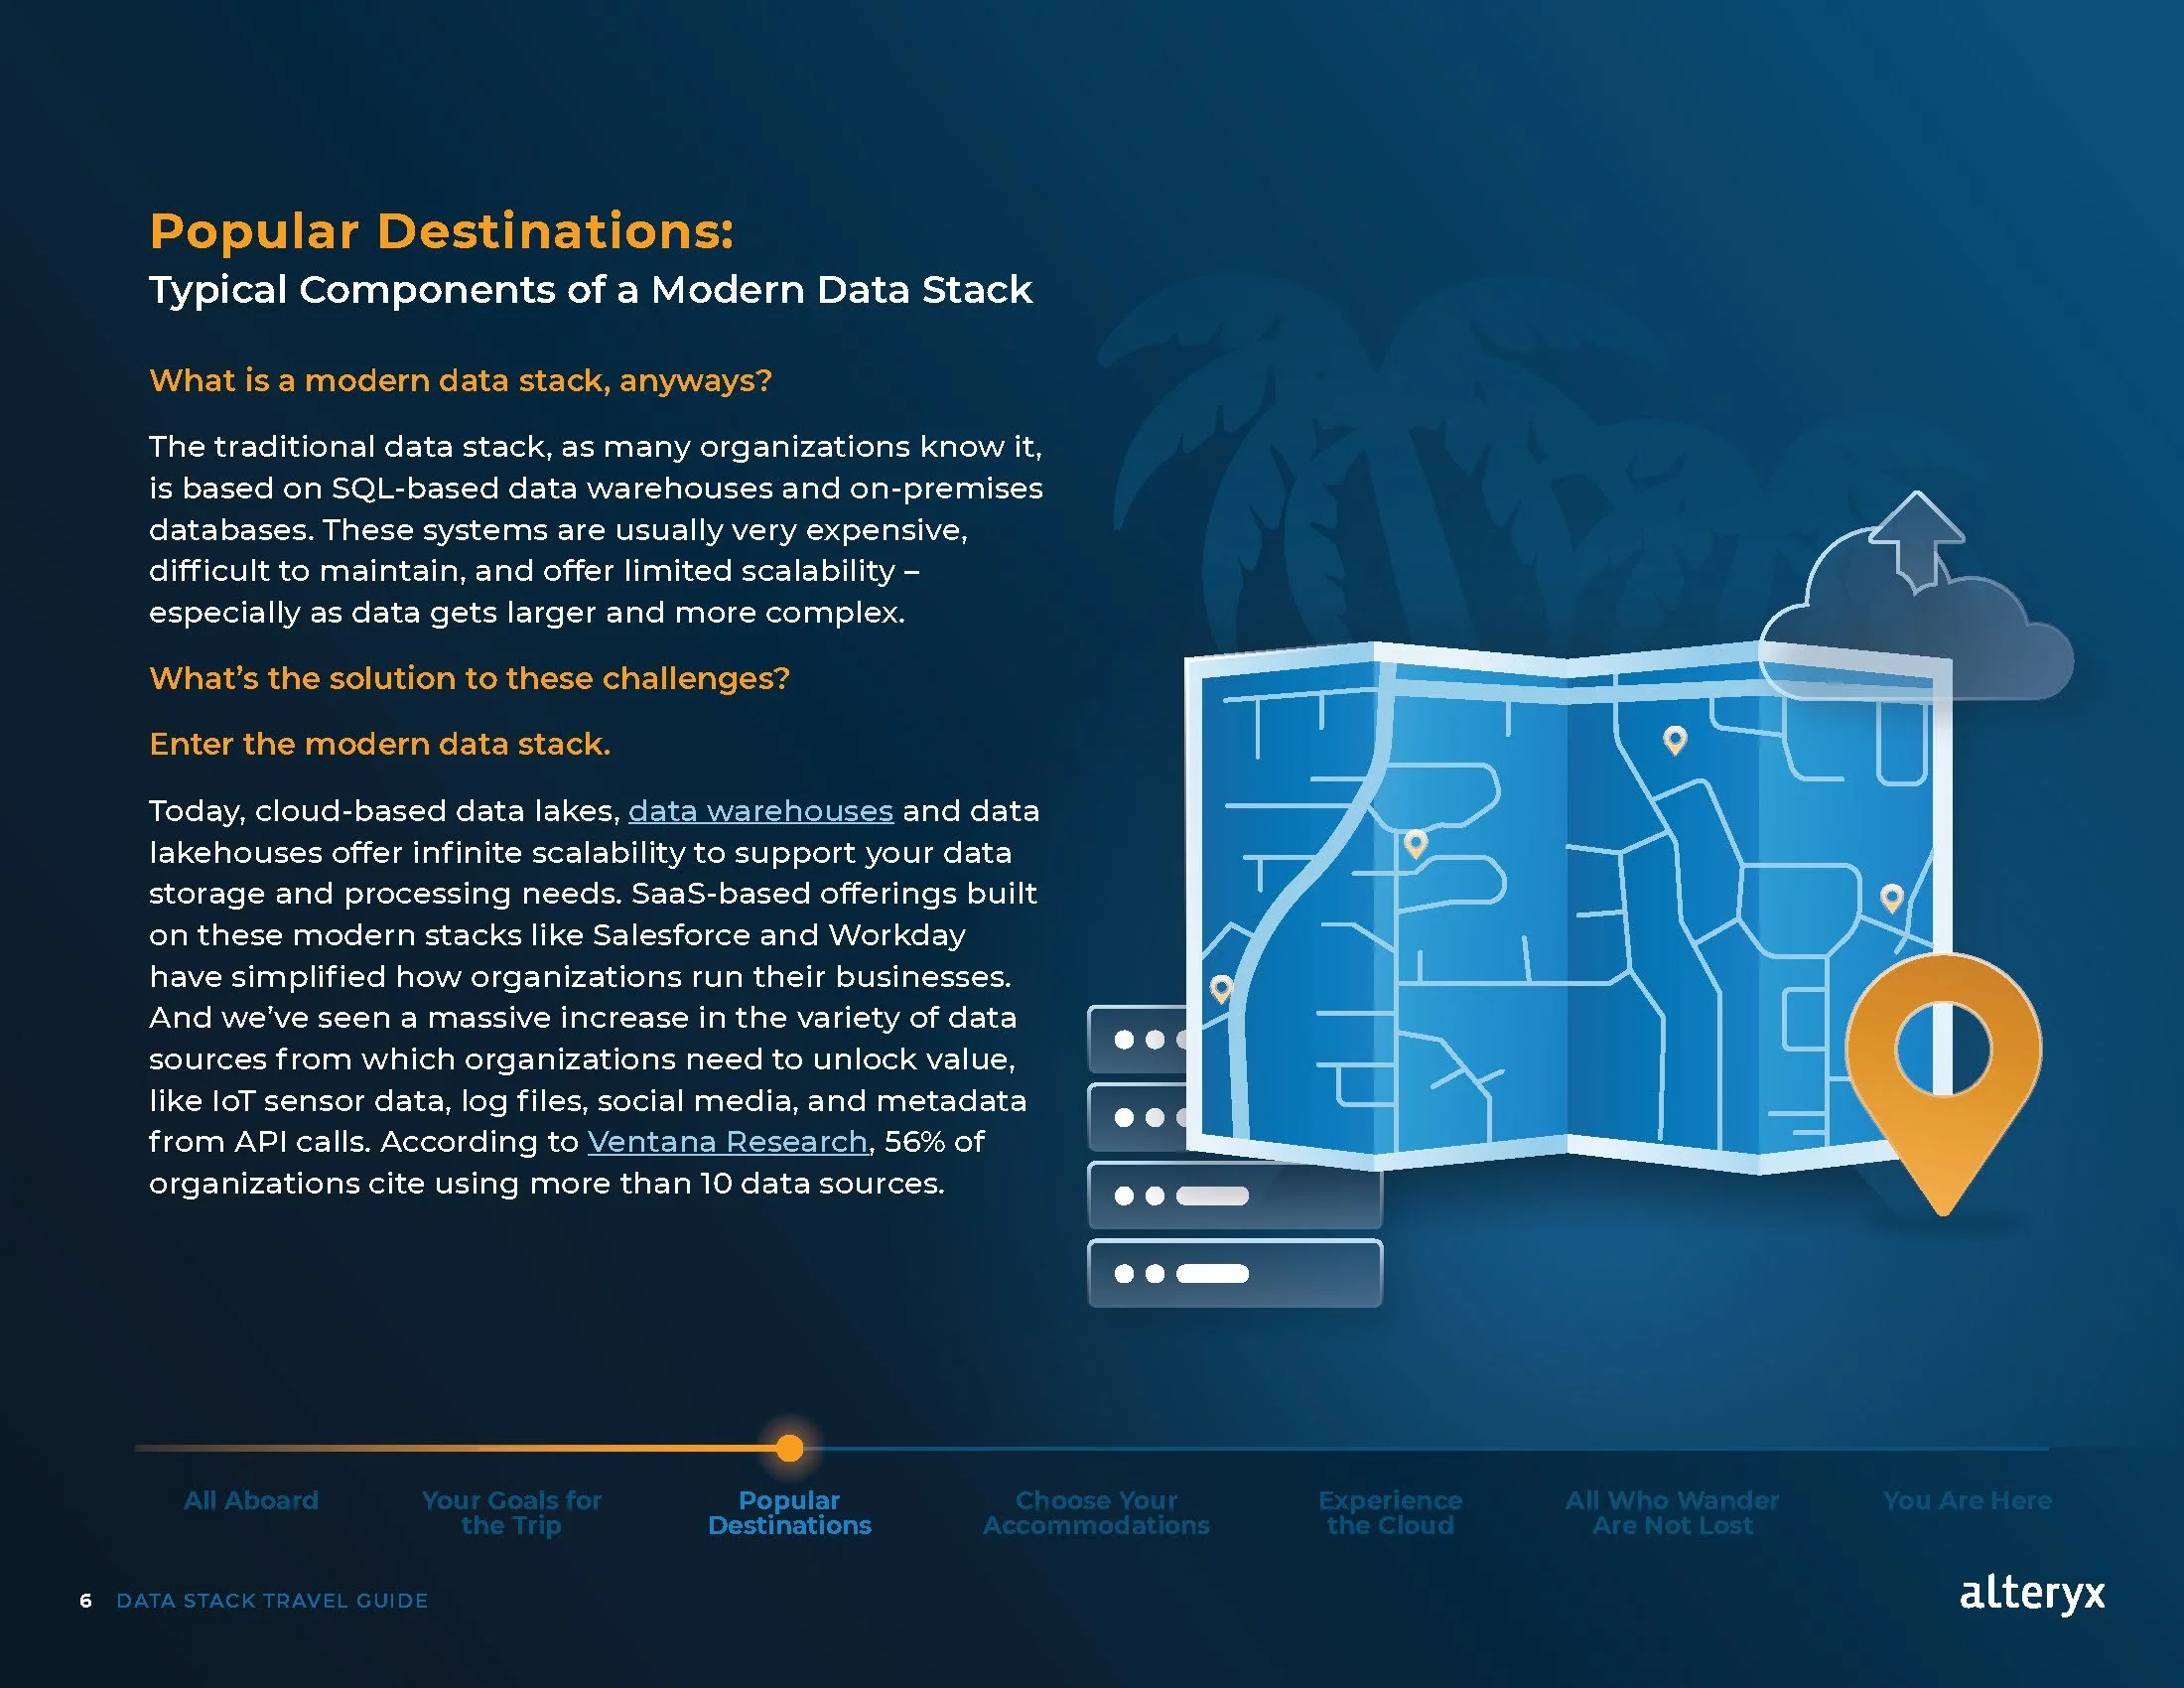
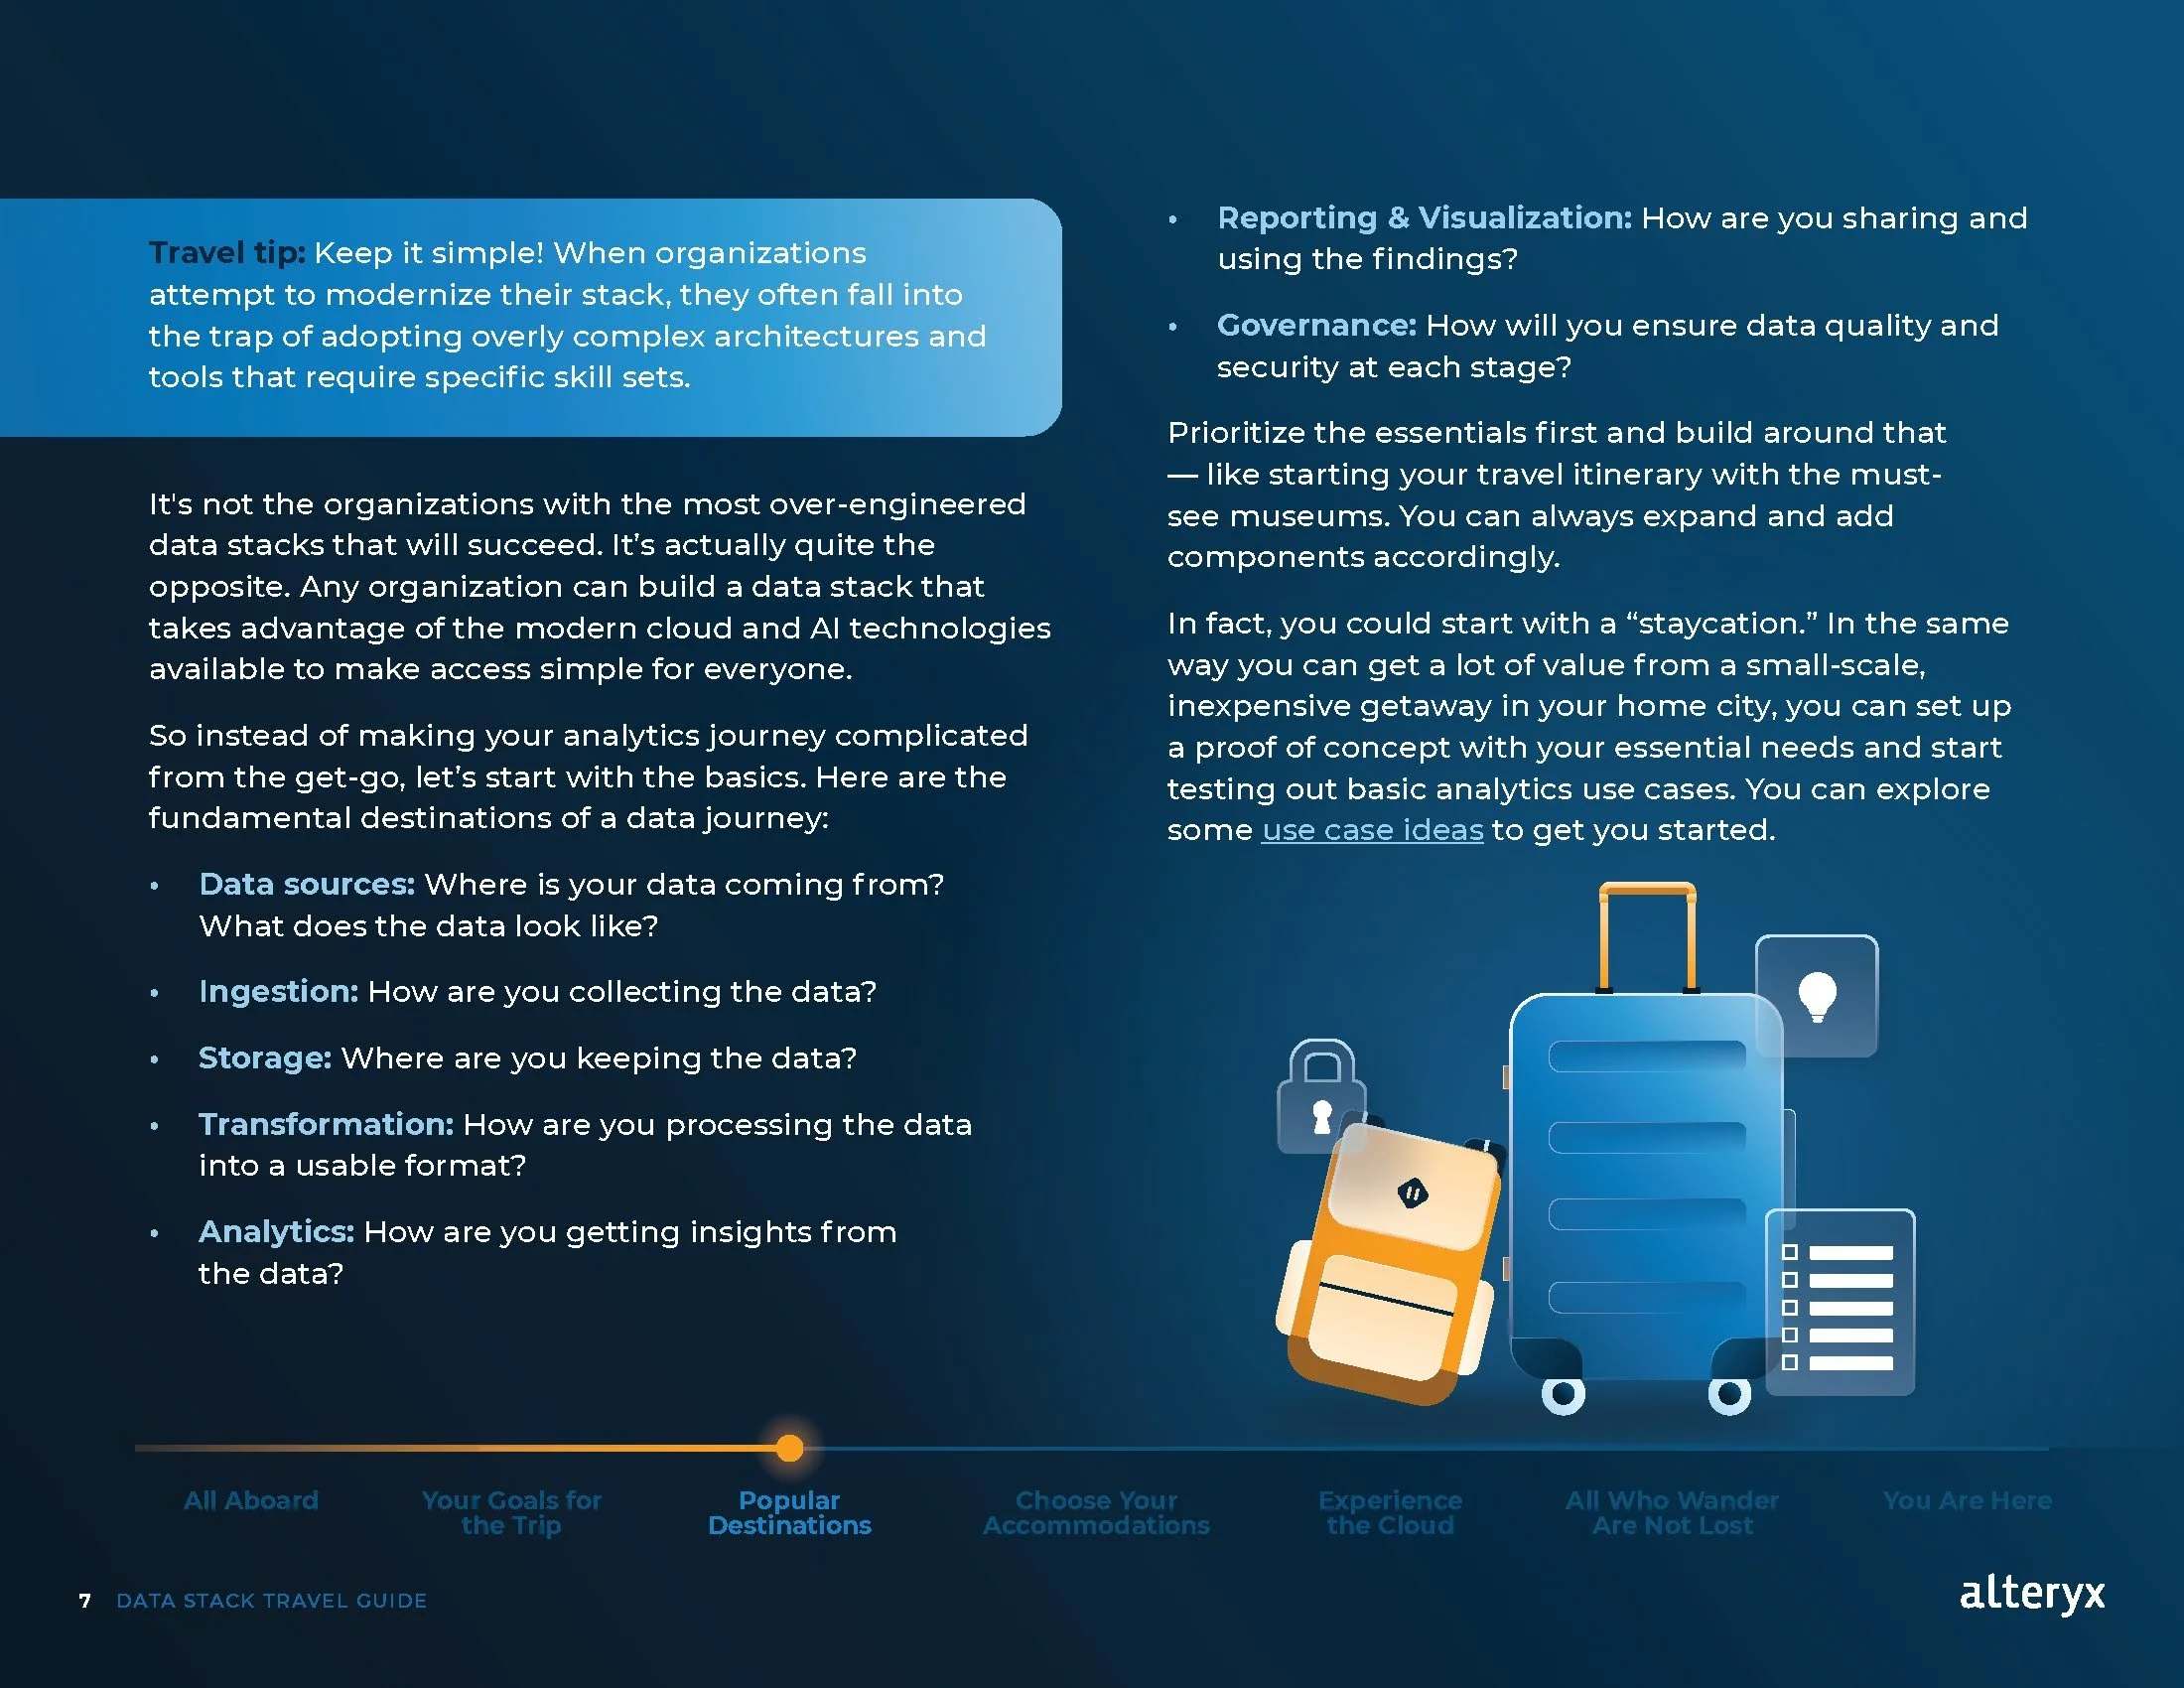
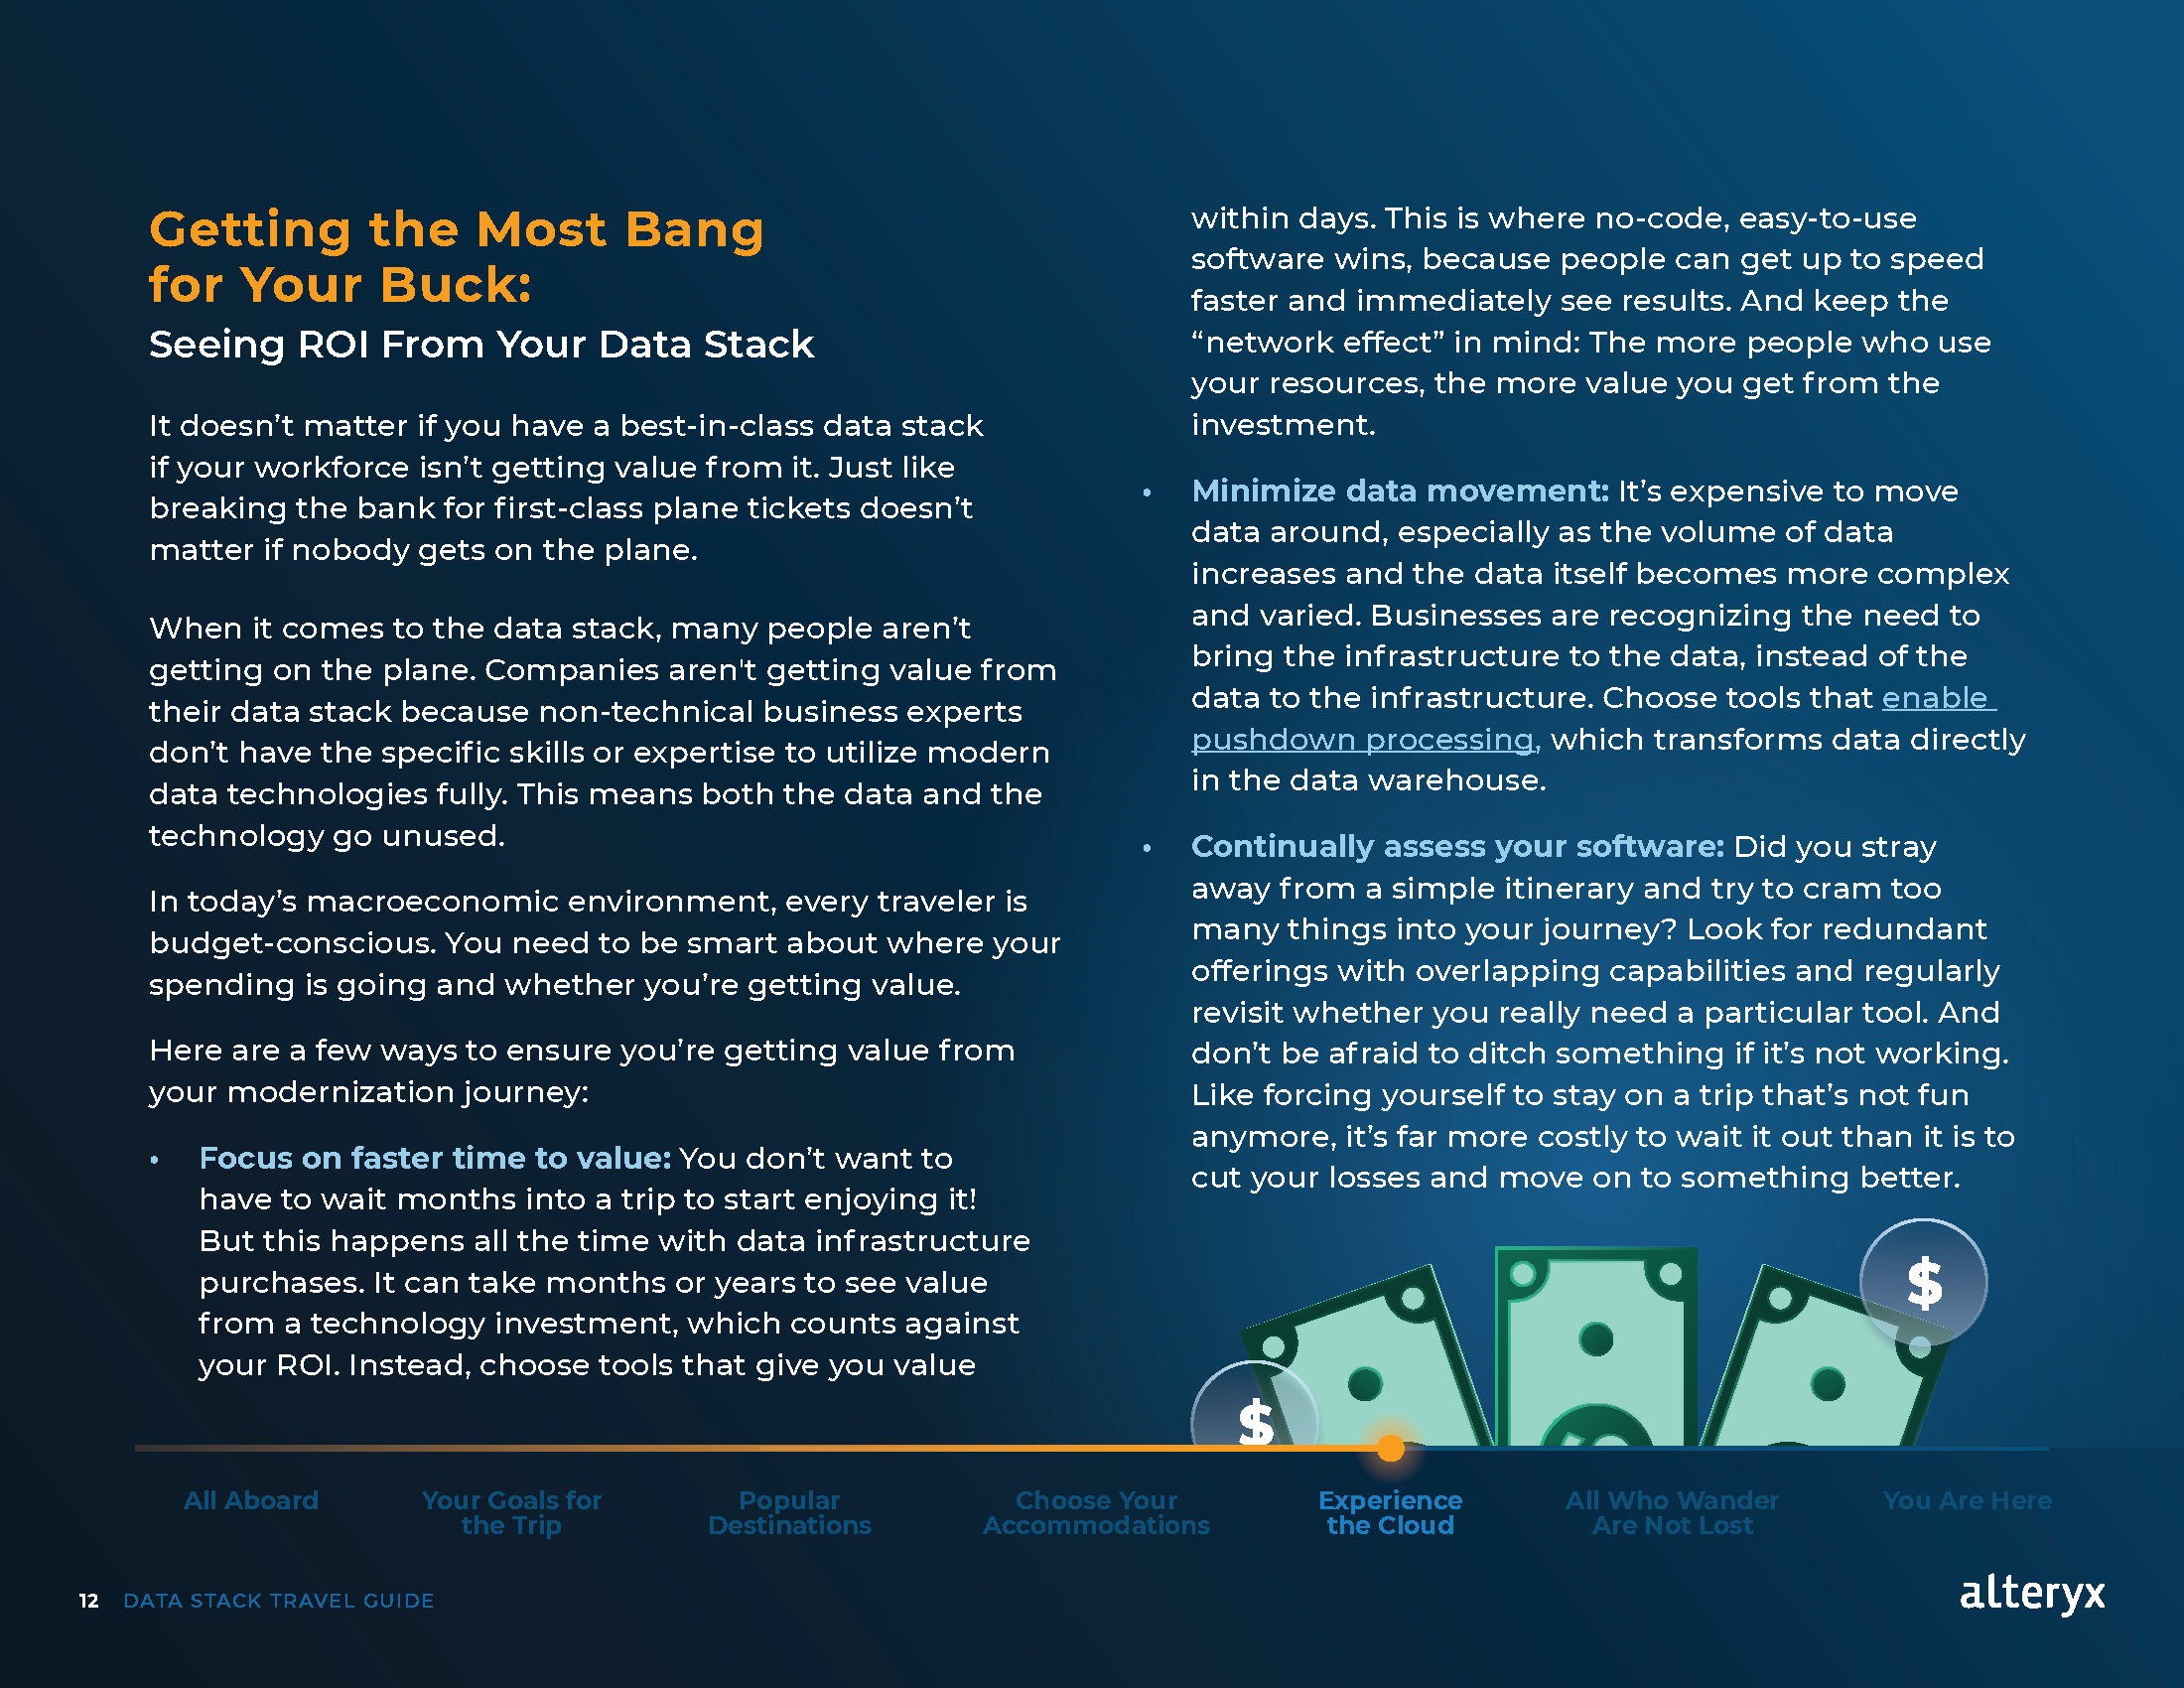
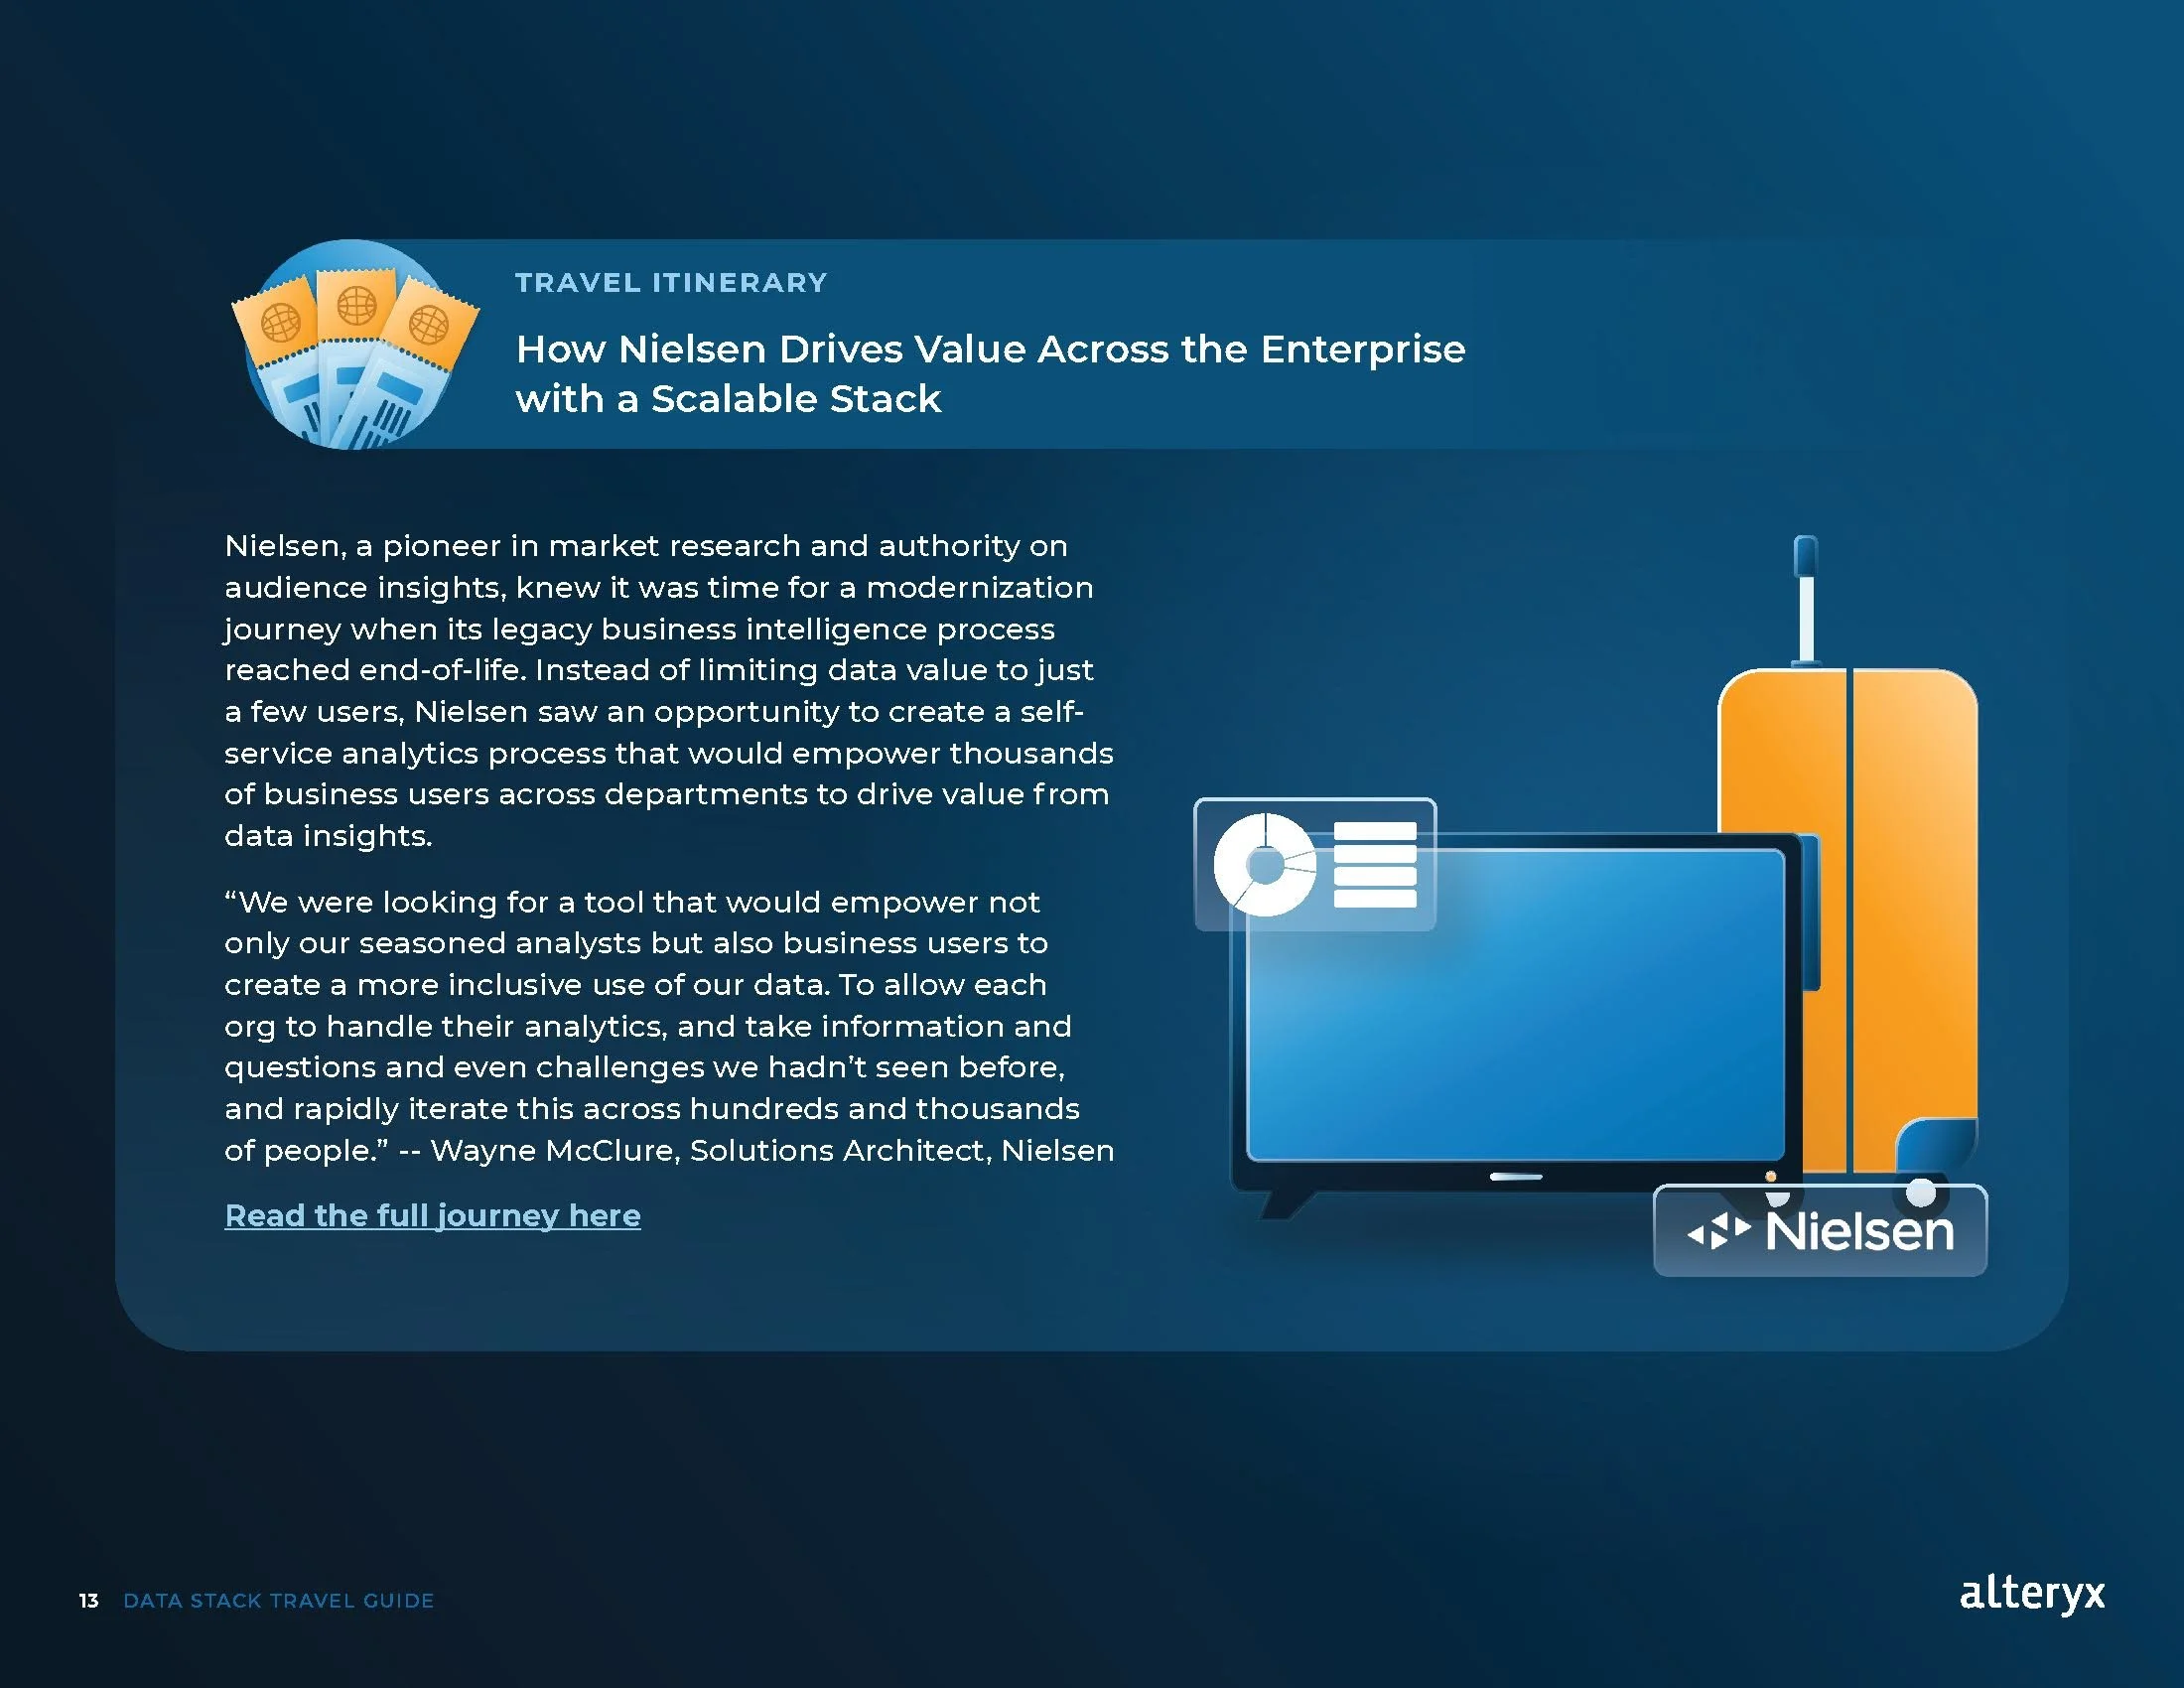
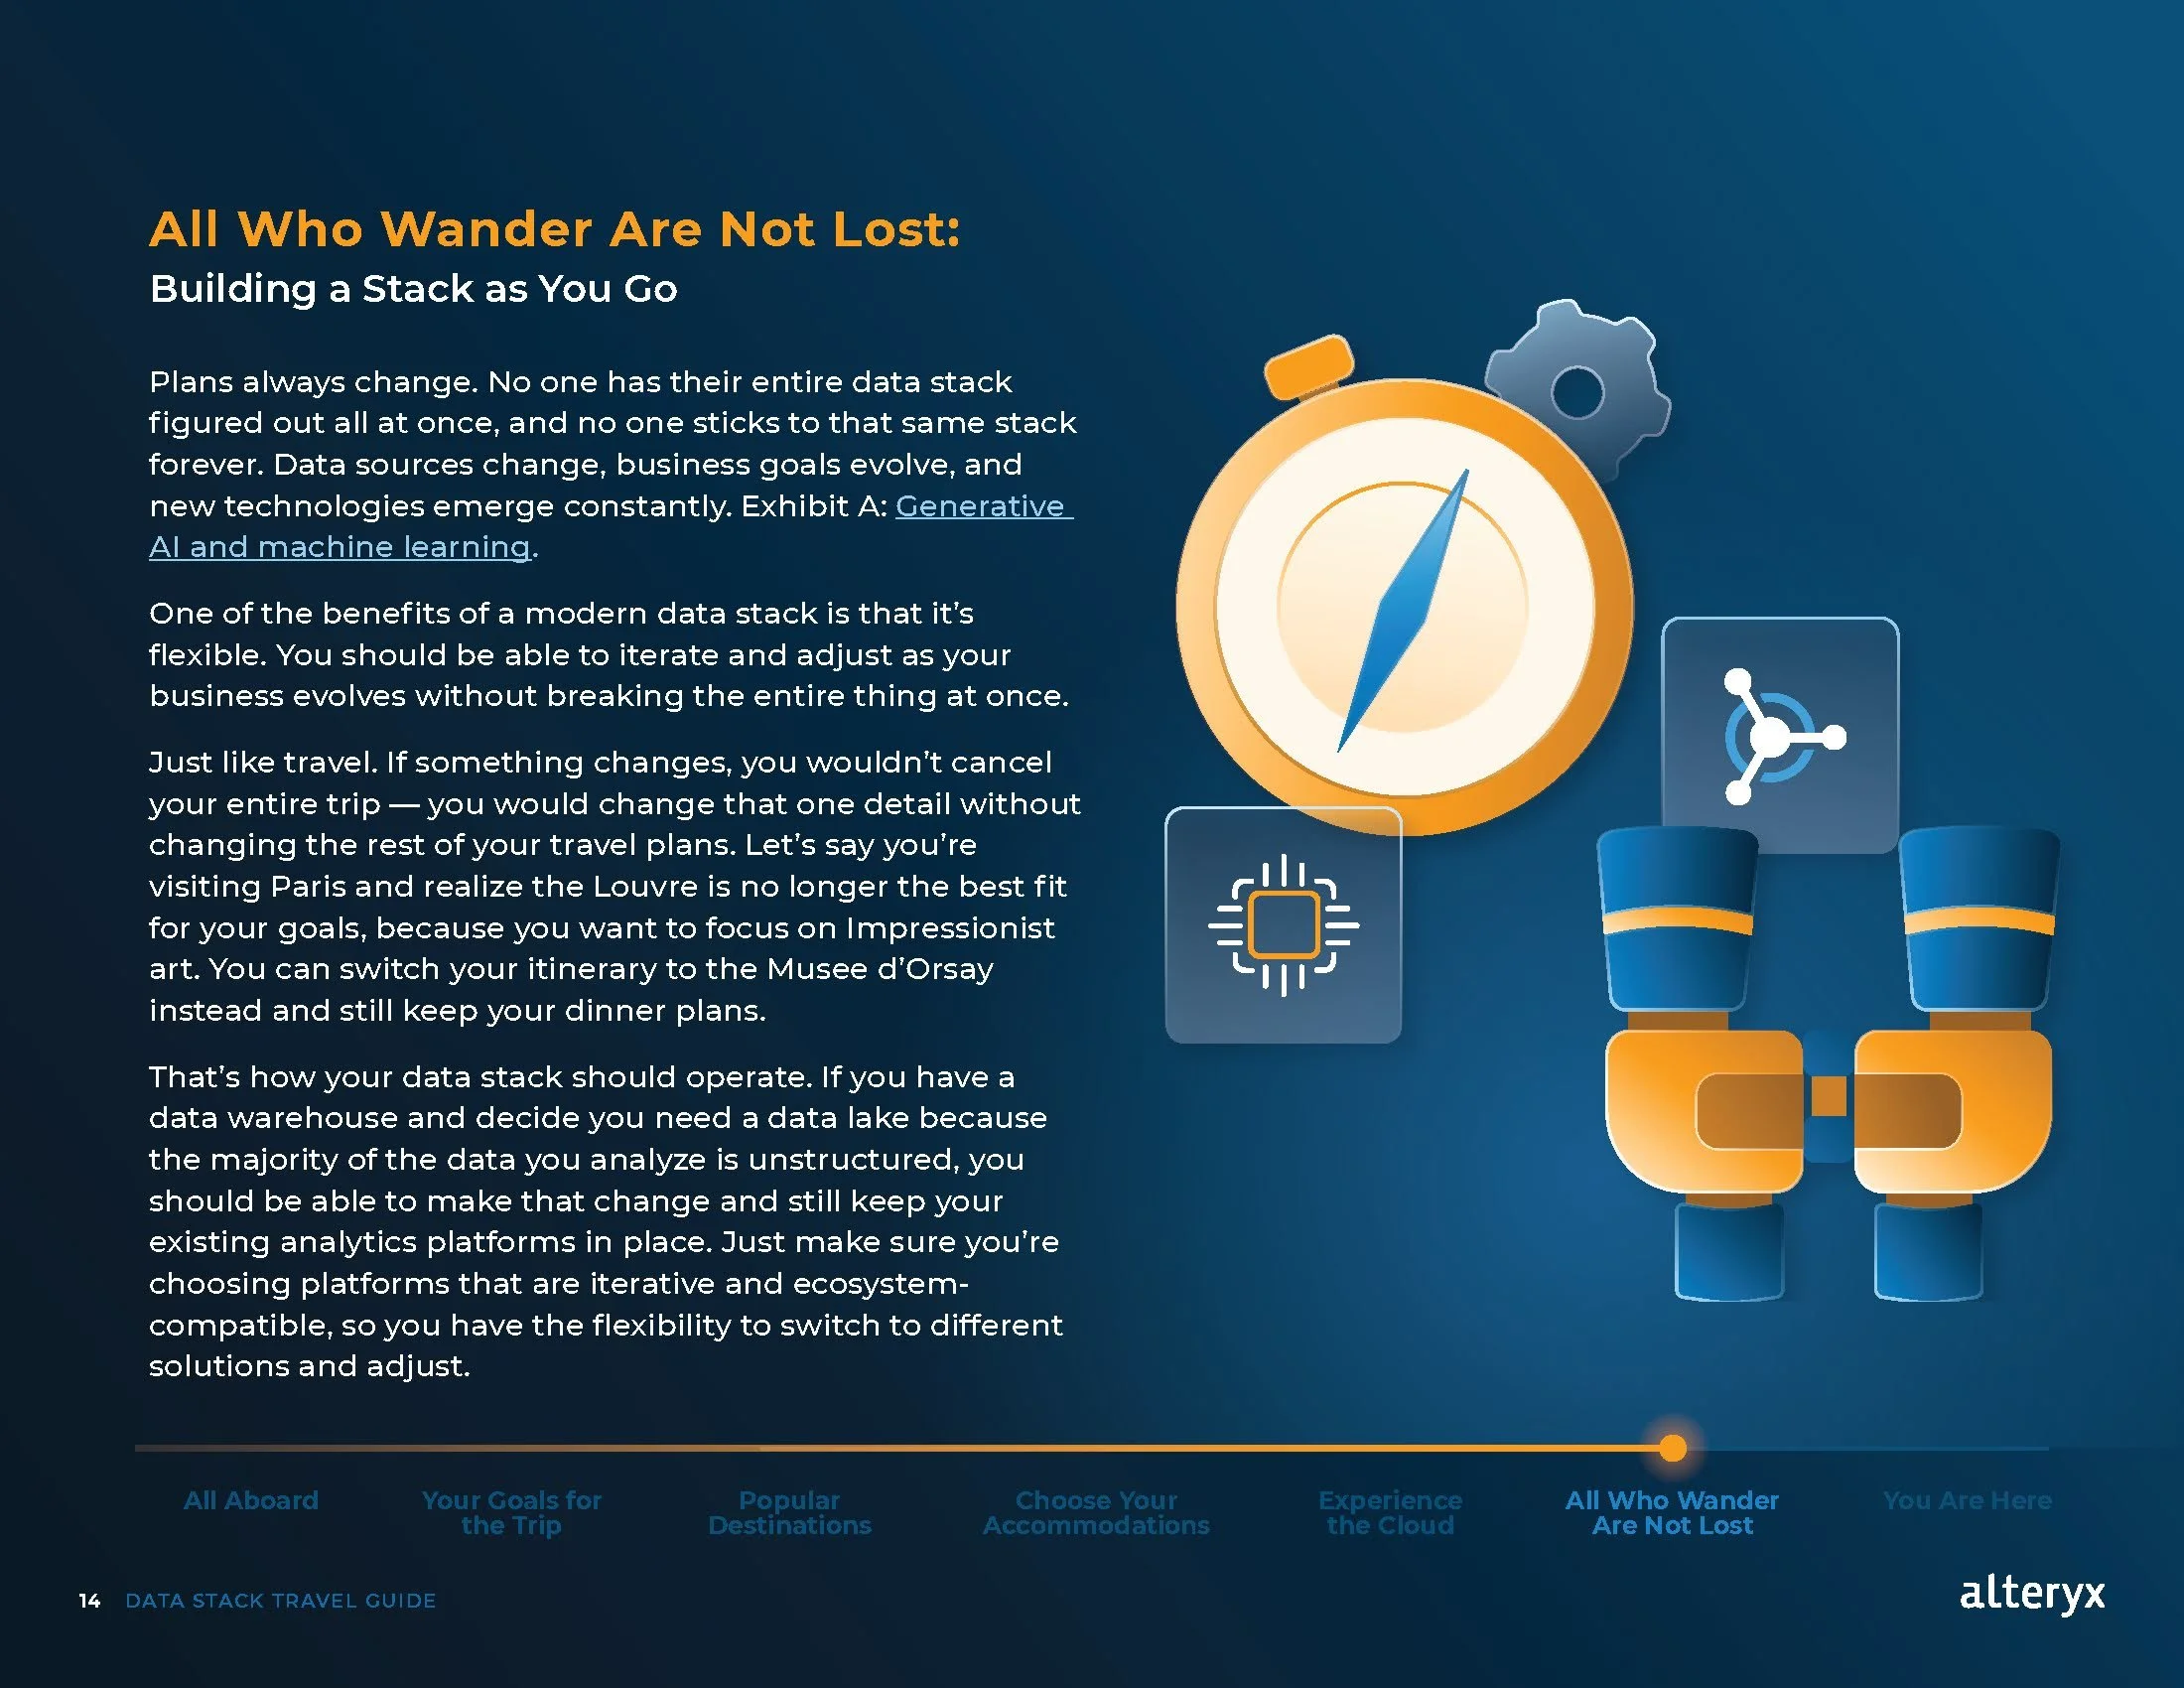
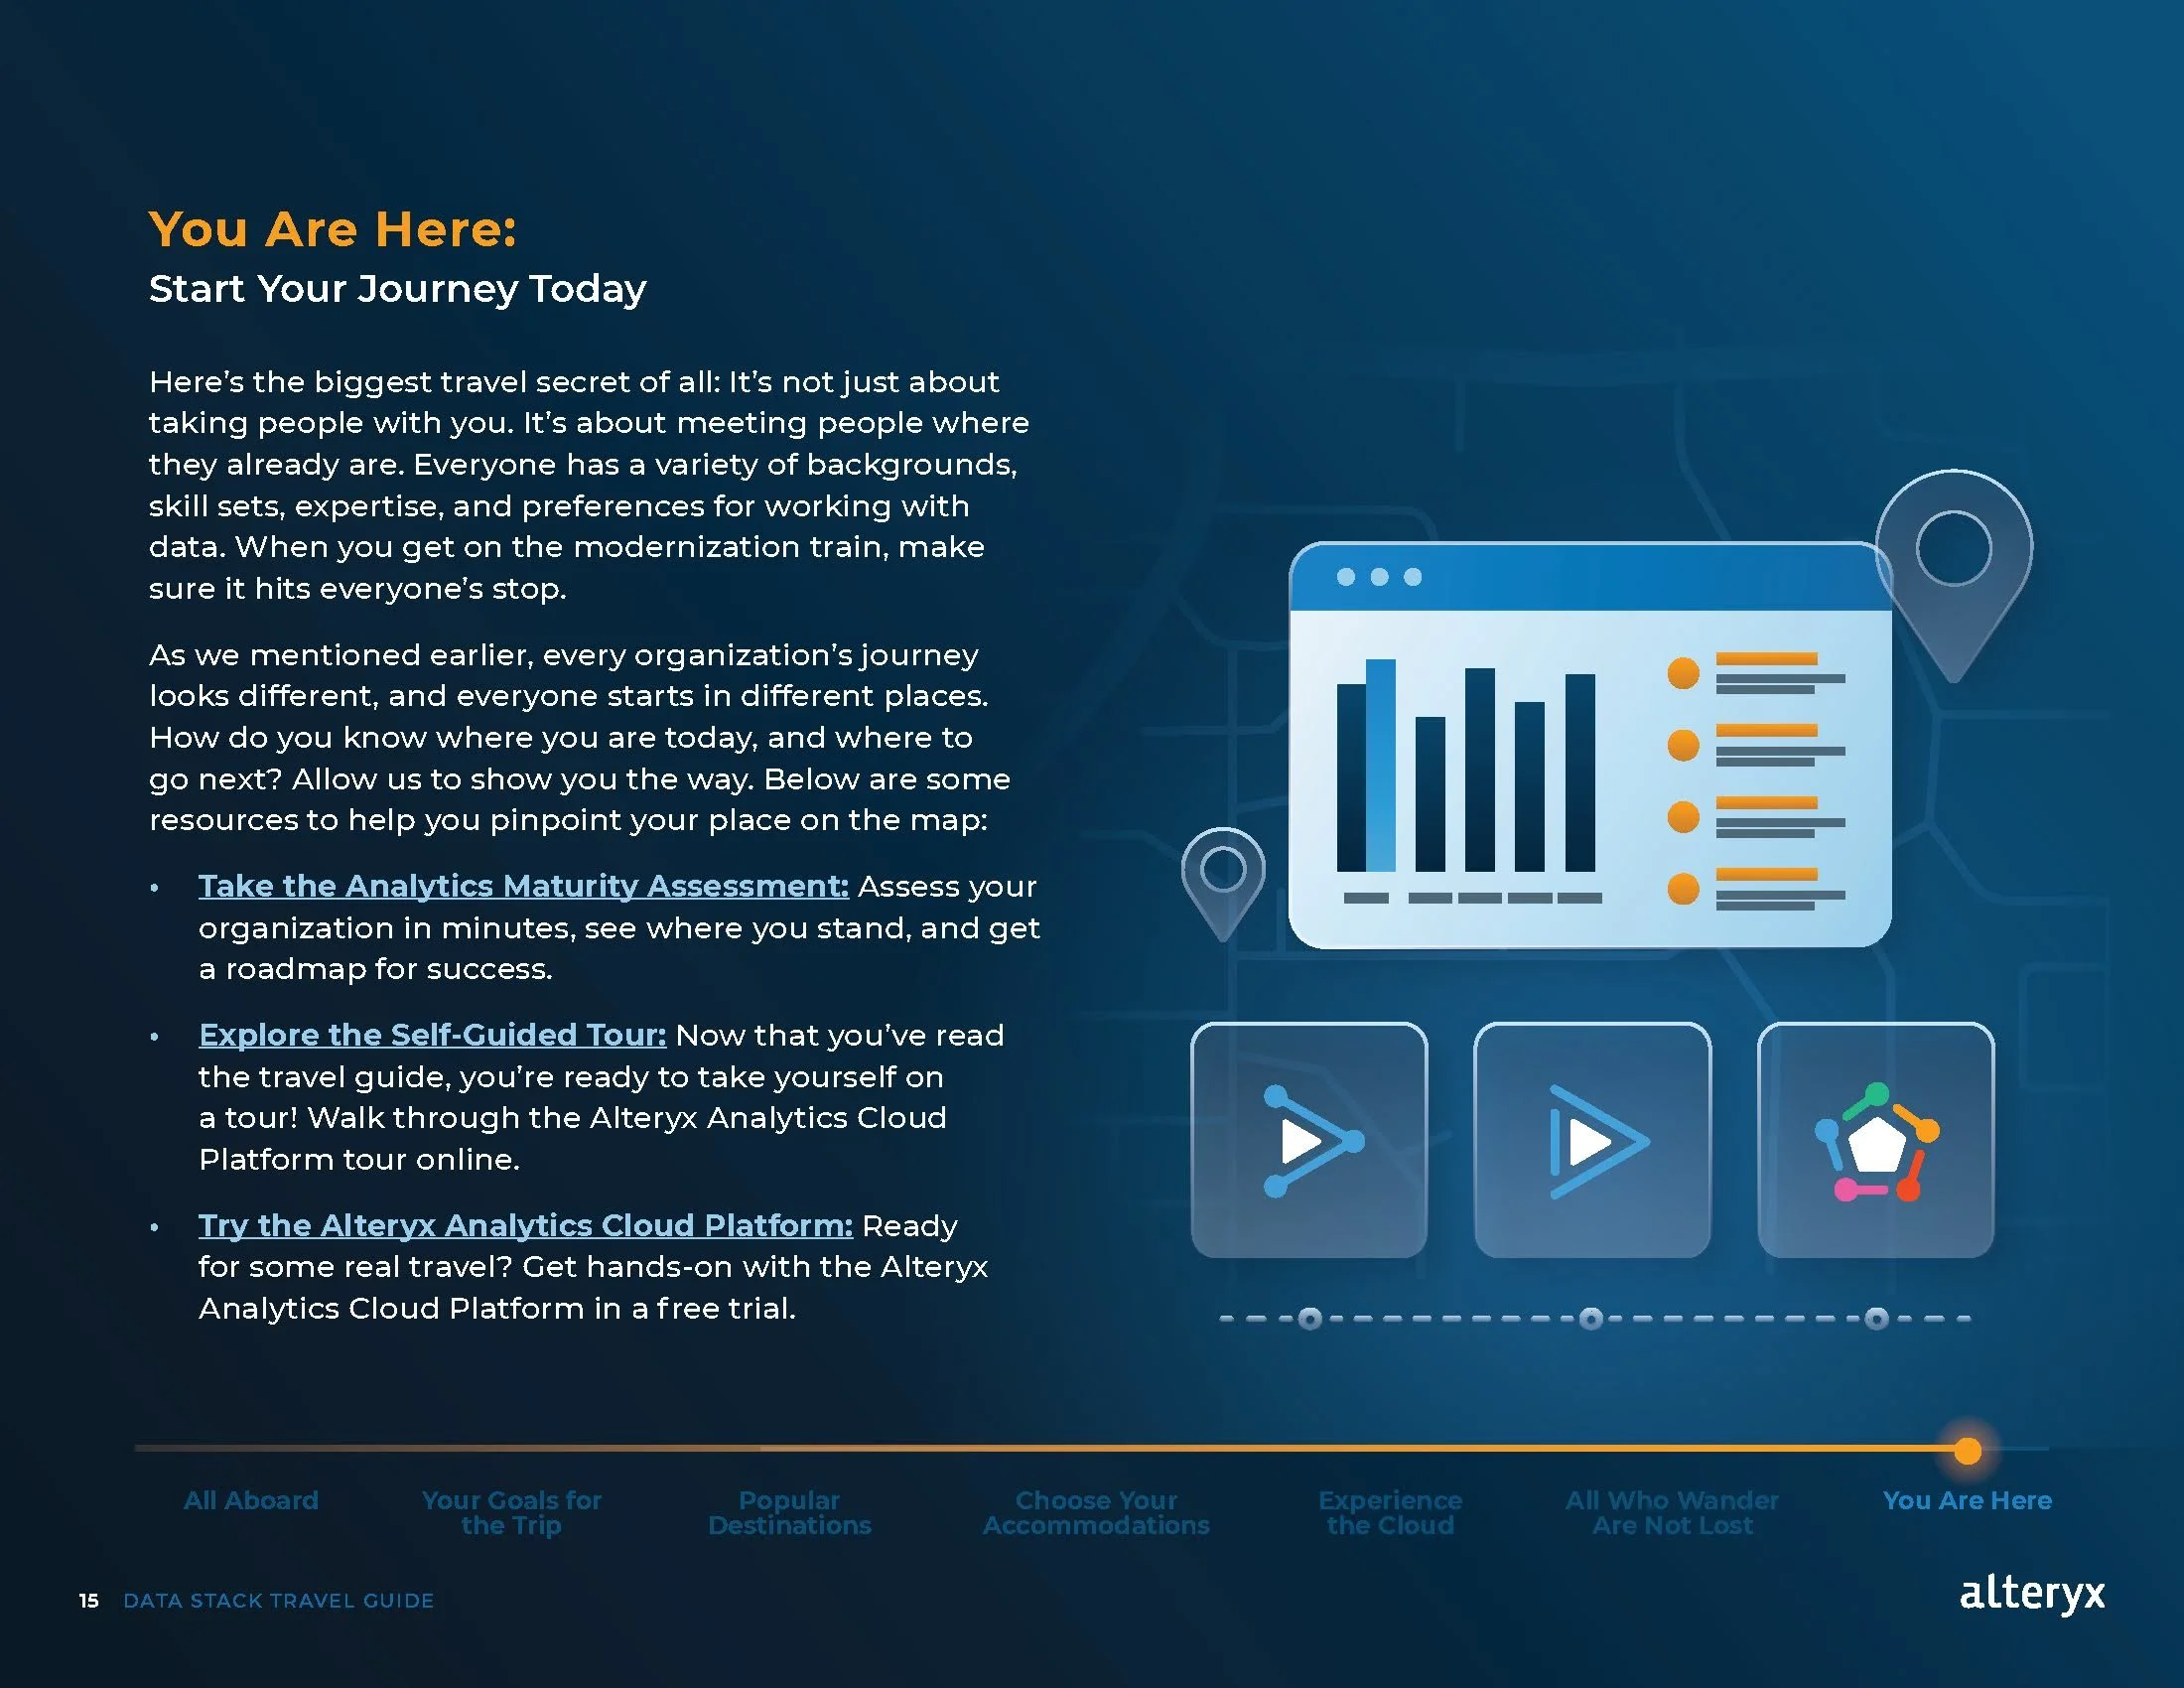
The pages below are the final layouts from the booklet. One major thing I learned from working on this booklet was implementing stakeholder feedback When they asked for images to be included in the book, we had to use our best judgment in what made sense to add or not include.
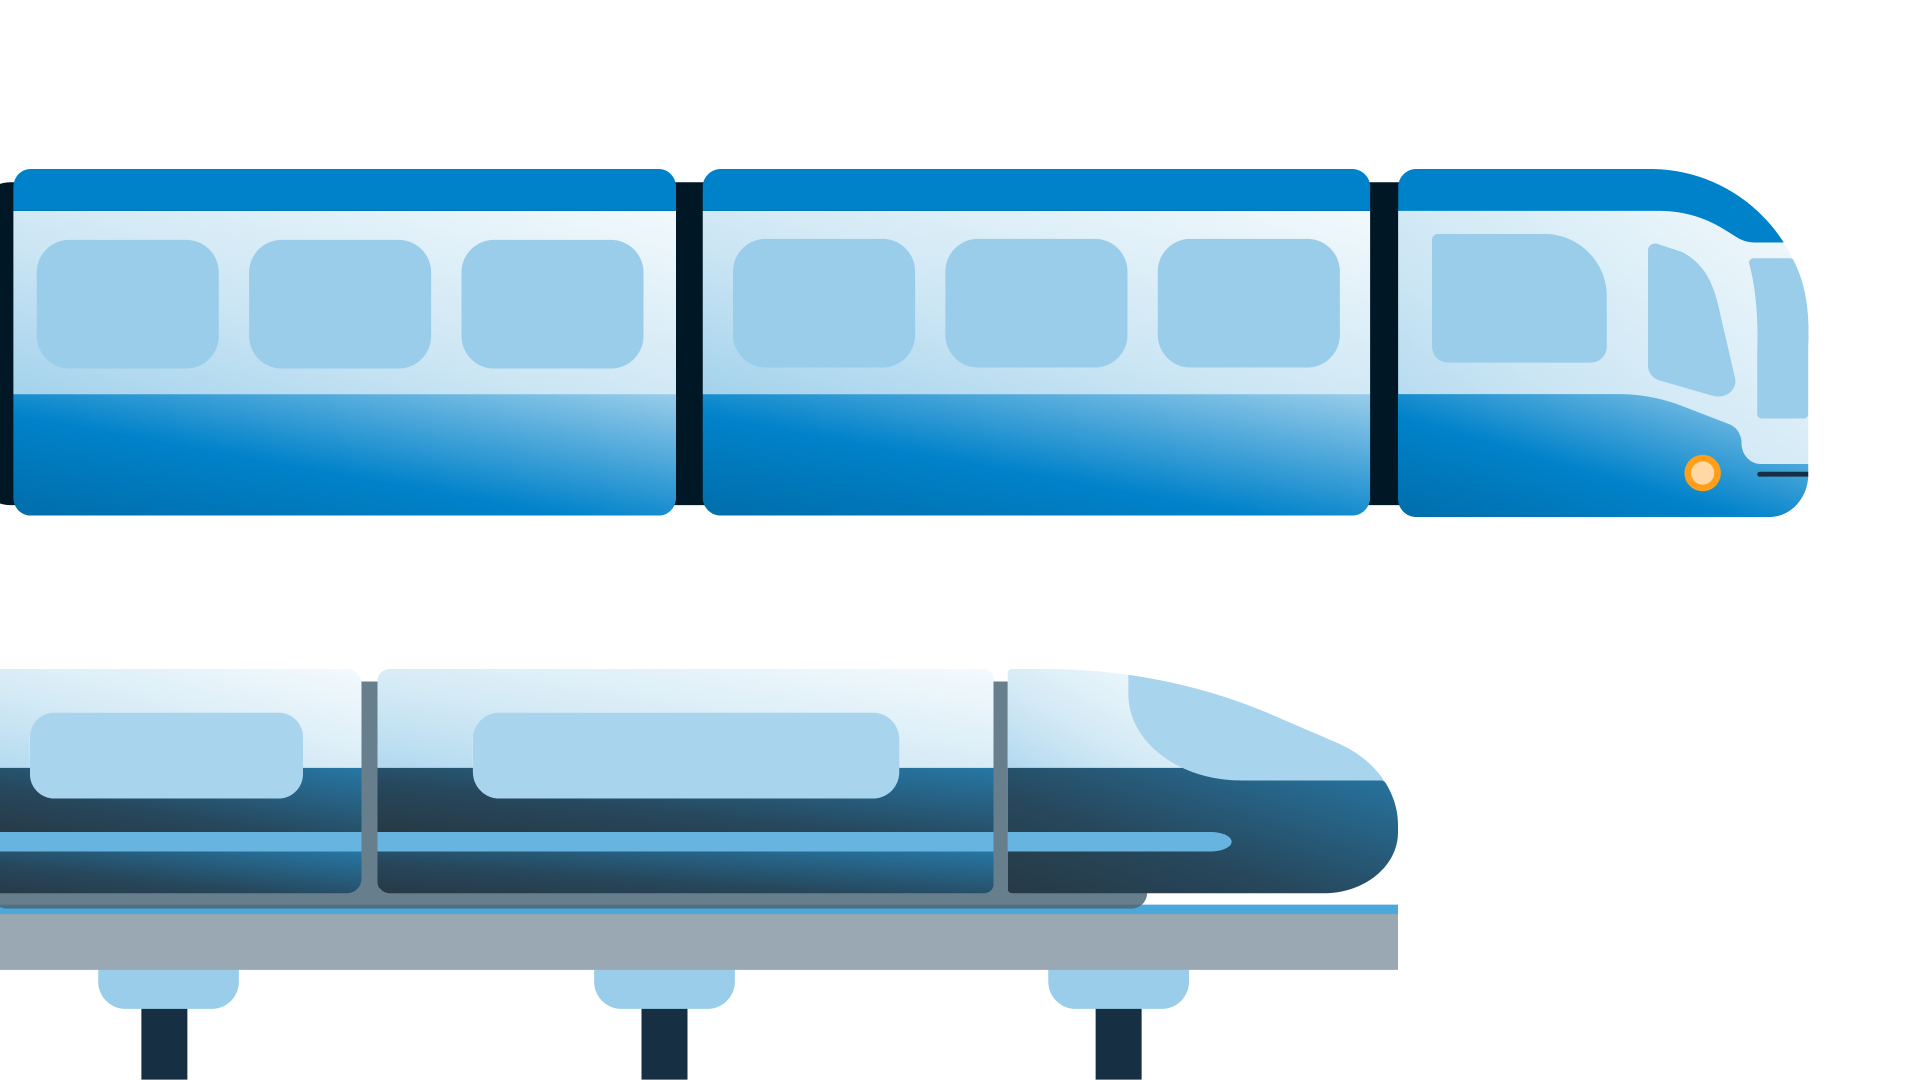
Here are more of the earlier concepts for the images in the book. The style I started with was mostly flat, but I did end up editing the colors to showcase our play of gradients and transparency. Those edits gave it more of a 3D look and worked seamlessly in the final product.


FINAL LAYOUTS


Promos